MOBIS-COVID19/04
Results as of 27/04/2020
A Project of IVT, ETH Zurich and WWZ, University of Basel
Contact: Joseph Molloy (joseph.molloy@ivt.baug.ethz.ch)
Previous and future reports can be found at: https://ivtmobis.ethz.ch/mobis/covid19/en
News
27 April:
- New chart on the change in activity type by land zoning.
20 April:
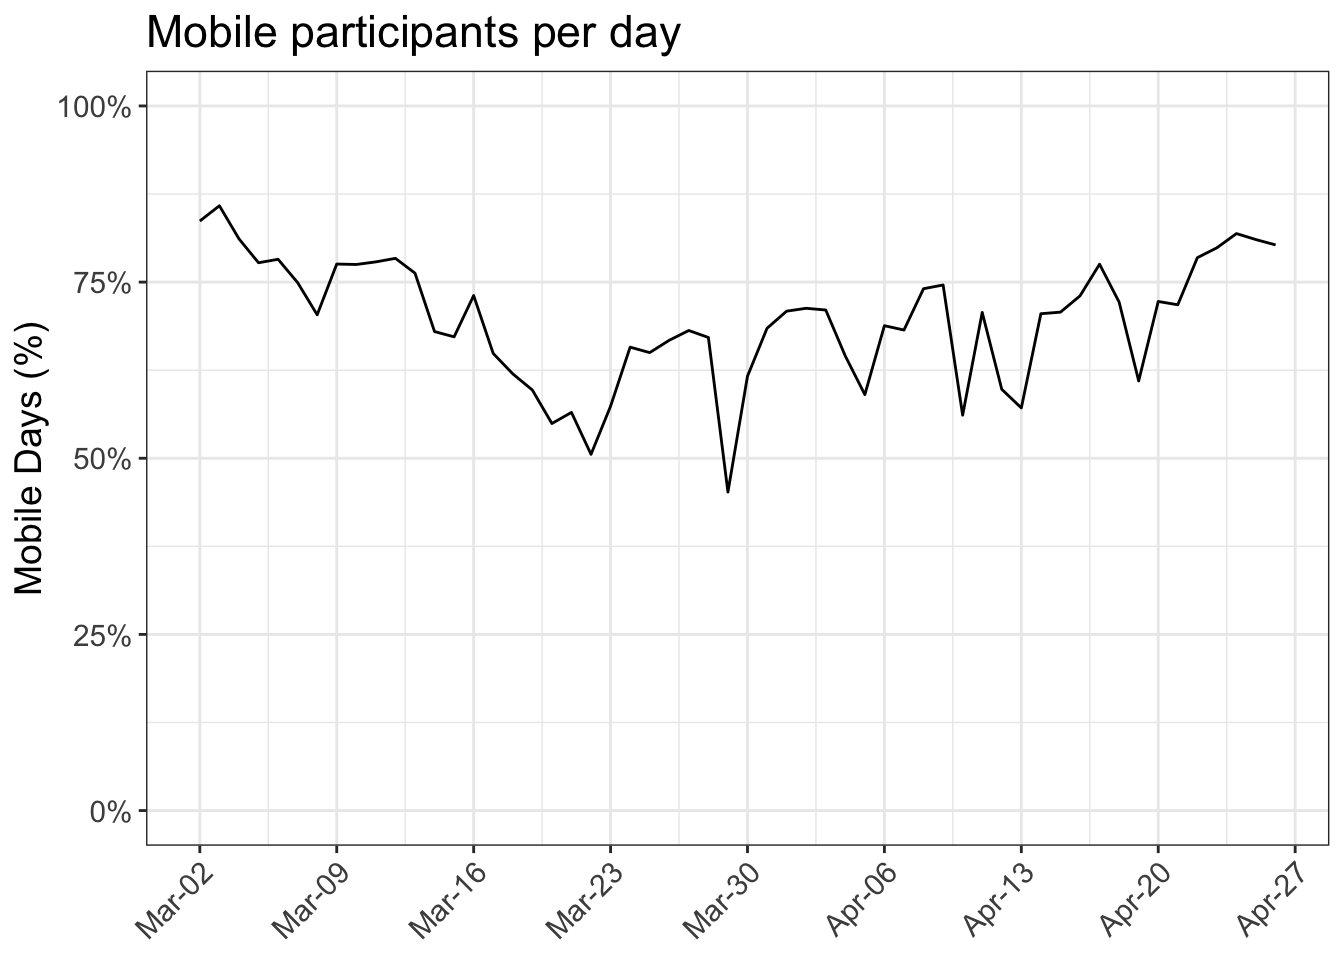
Mobile participants per day.
Non-mobile participants are now included in the activity-space numbers in addtion to a new table on median weekly activity spaces.
New graphs, including average trip distance by mode.
Formatting improvements and other small corrections.
13 April:
- Earlier weeks have been grouped and colored grey in certain graphs.
Introduction
On March 16, 2020, 3700 participants who completed the MOBIS study between September 2019 and Janurary 2020 were invited to reinstall the GPS Logger and Travel Diary App ‘Catch-My-Day’, developed by MotionTag, to record their mobility behaviour during the period of special measures implemented to control the spread of the Corona Virus. The first 4 weeks of mobility data from the original MOBIS Study is taken for each participant as a baseline against which to compare current mobility patterns. These 4 weeks start place anywhere between 1st September and 15th November, depending on the participant. Only trips in Switzerland are currently considered, although data on cross border travel is available.
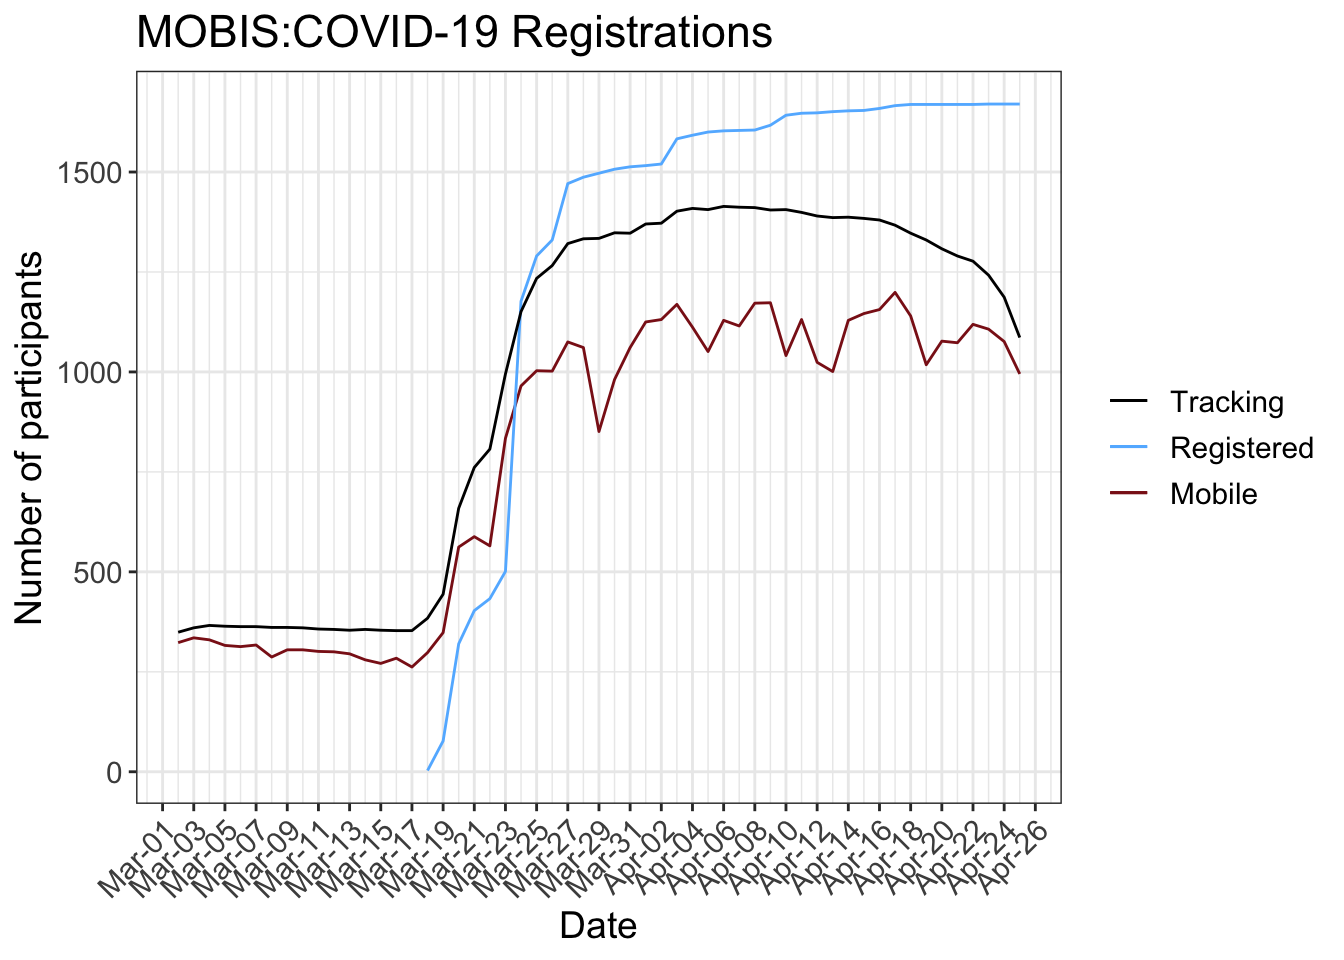
The following figure shows the number of registered and tracking participants per day. A running panel of around 250 participants were already tracking before the sample was reinvited. This allows results for the weeks before the MOBIS:COVID-19 study was officially started, although the sample size is a lot smaller, and hence the results.
In the MOBIS study, participants were only eligible if they used a car at least 3 days a week - which skews the sample away from the Swiss general population.
The number of tracking participants each day used to calculate the average daily values includes all participants who recorded tracks before or after that date. This allows the consideration of those who stay at home while still allowing for survey dropouts.
The GPS Travel diary used, Catch-My-Day (for iOS and Android) can have a 2-3 day delay before the tracks are available for analysis. The scaling by active participants accomodates for this, but the results of previous reports may change when the report is updated.
Participation
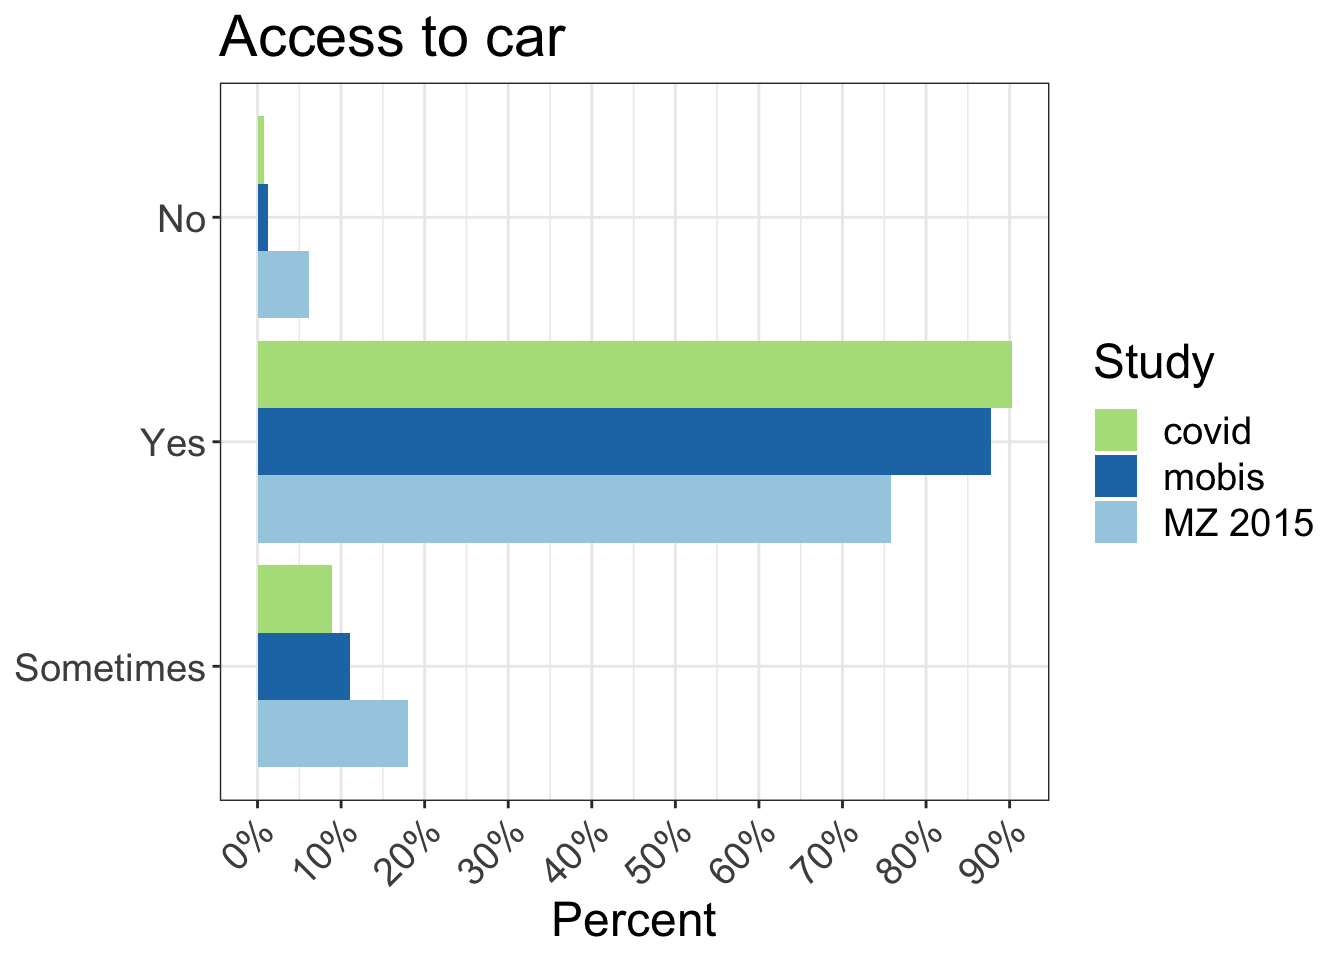
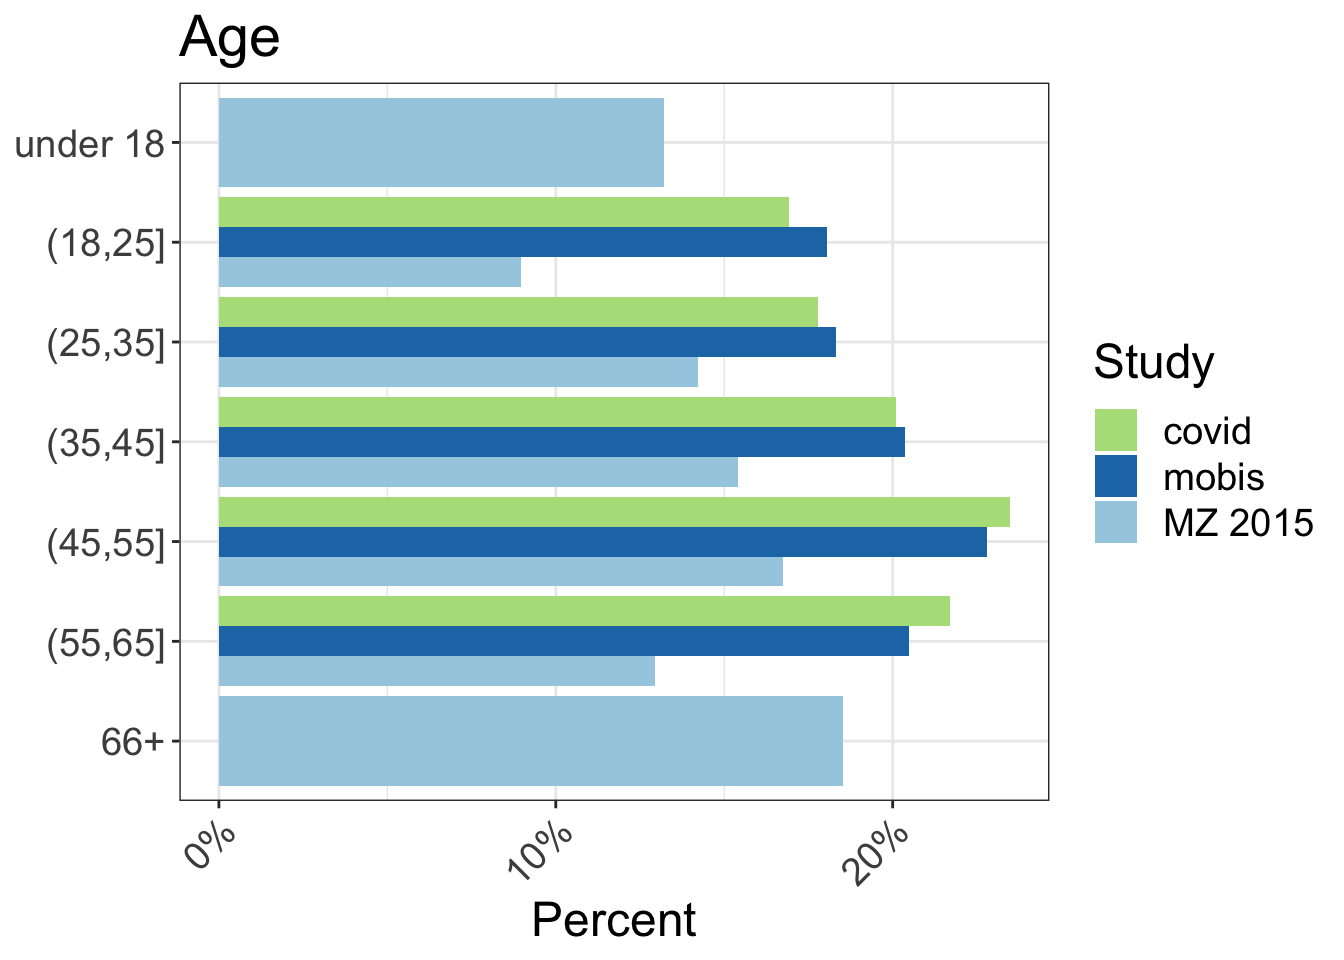
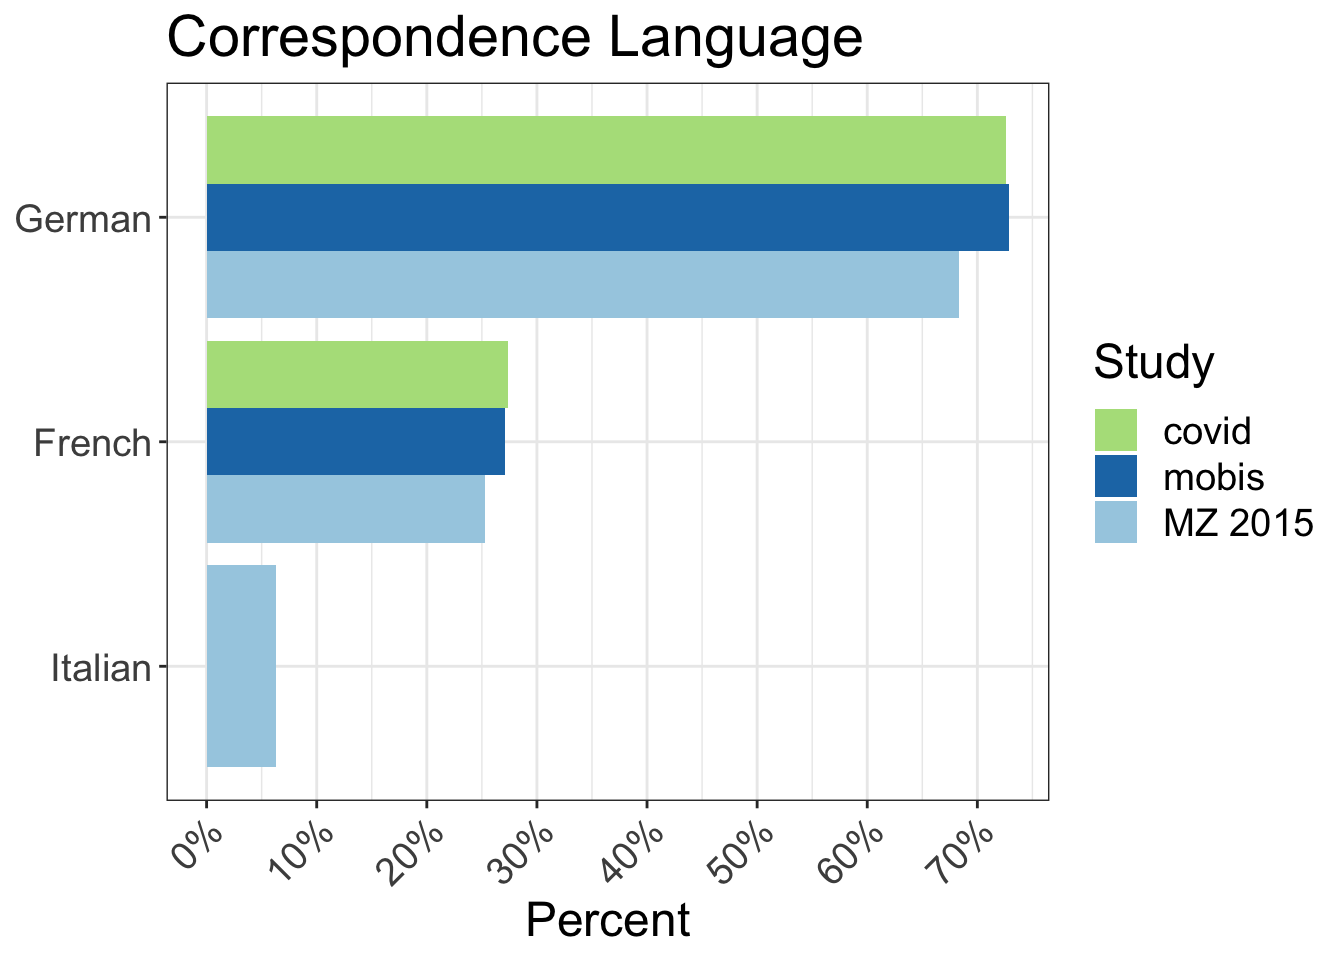
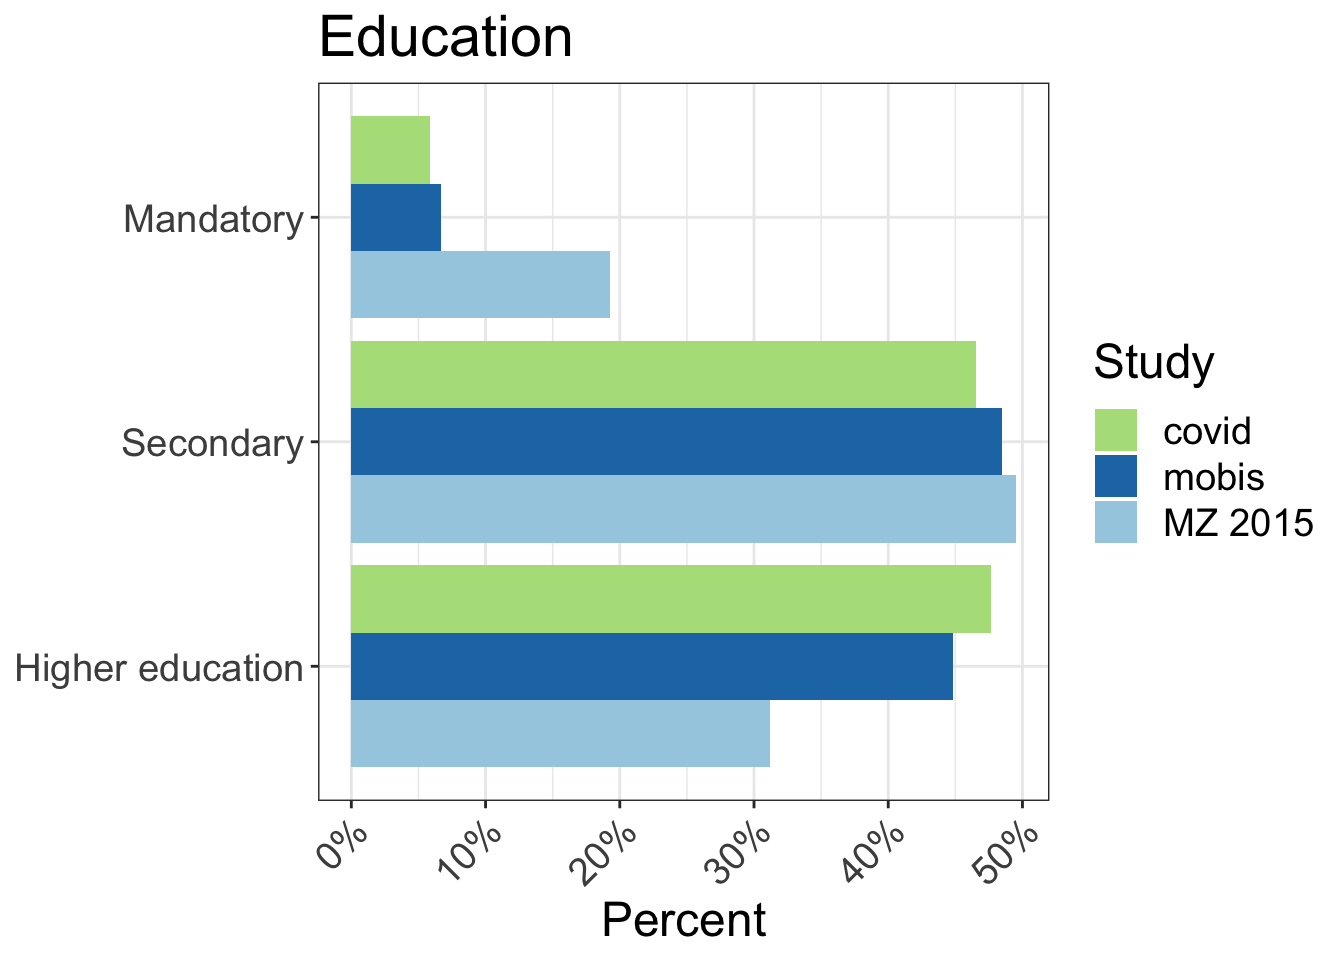
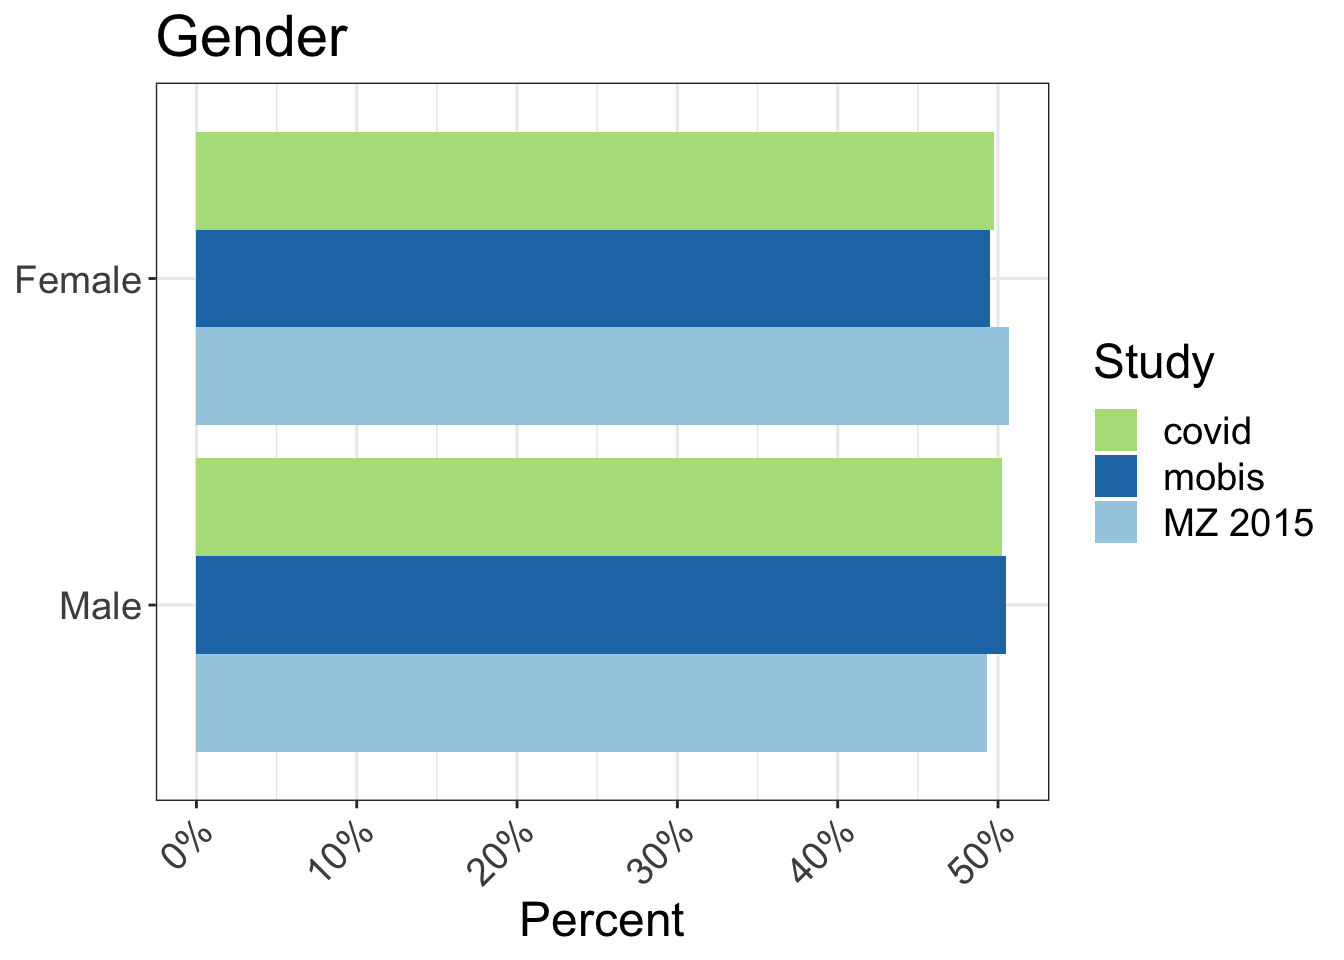
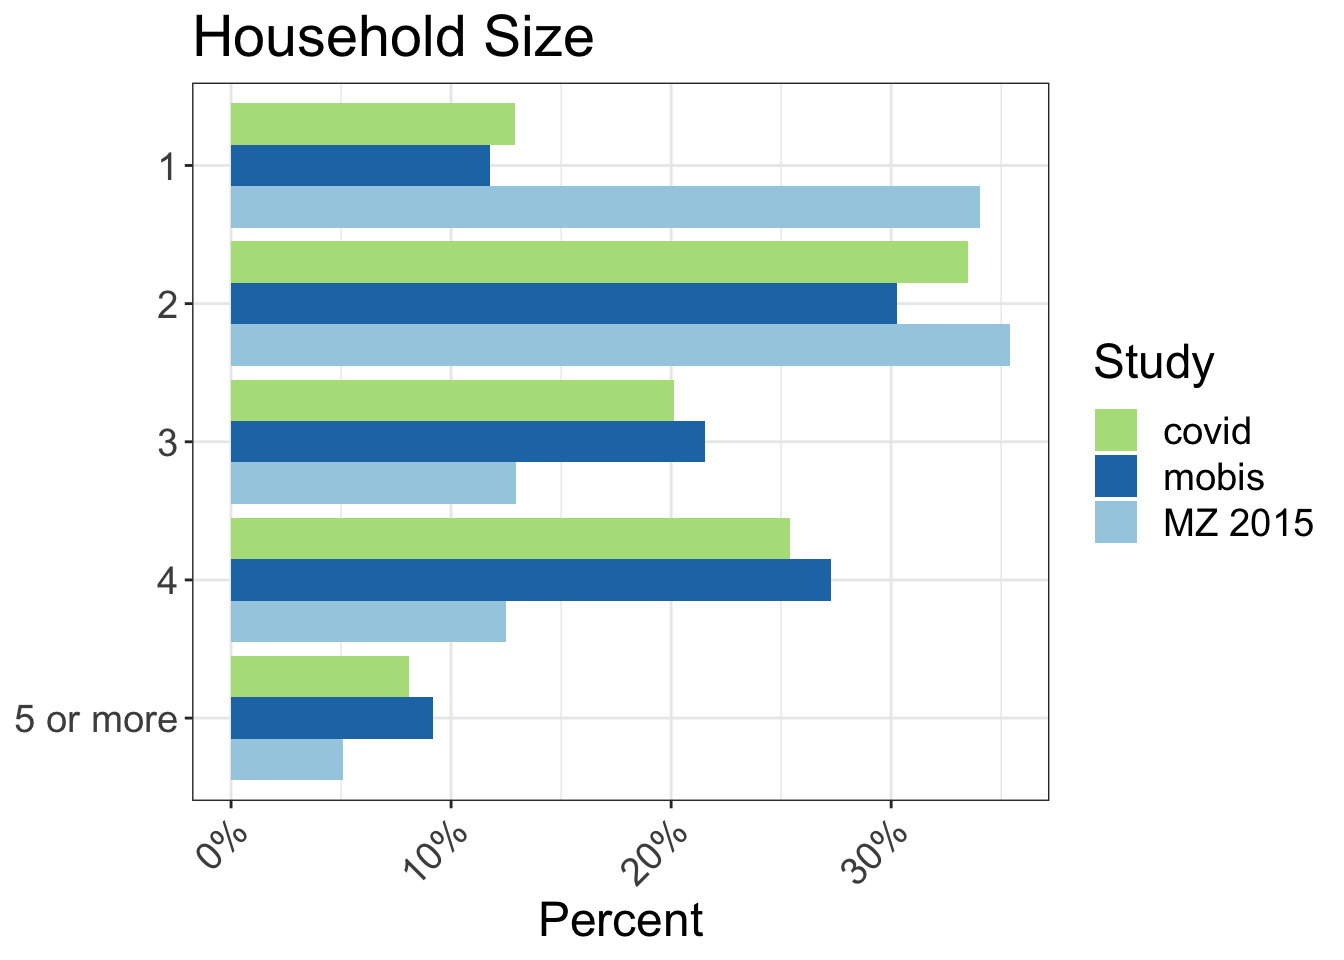
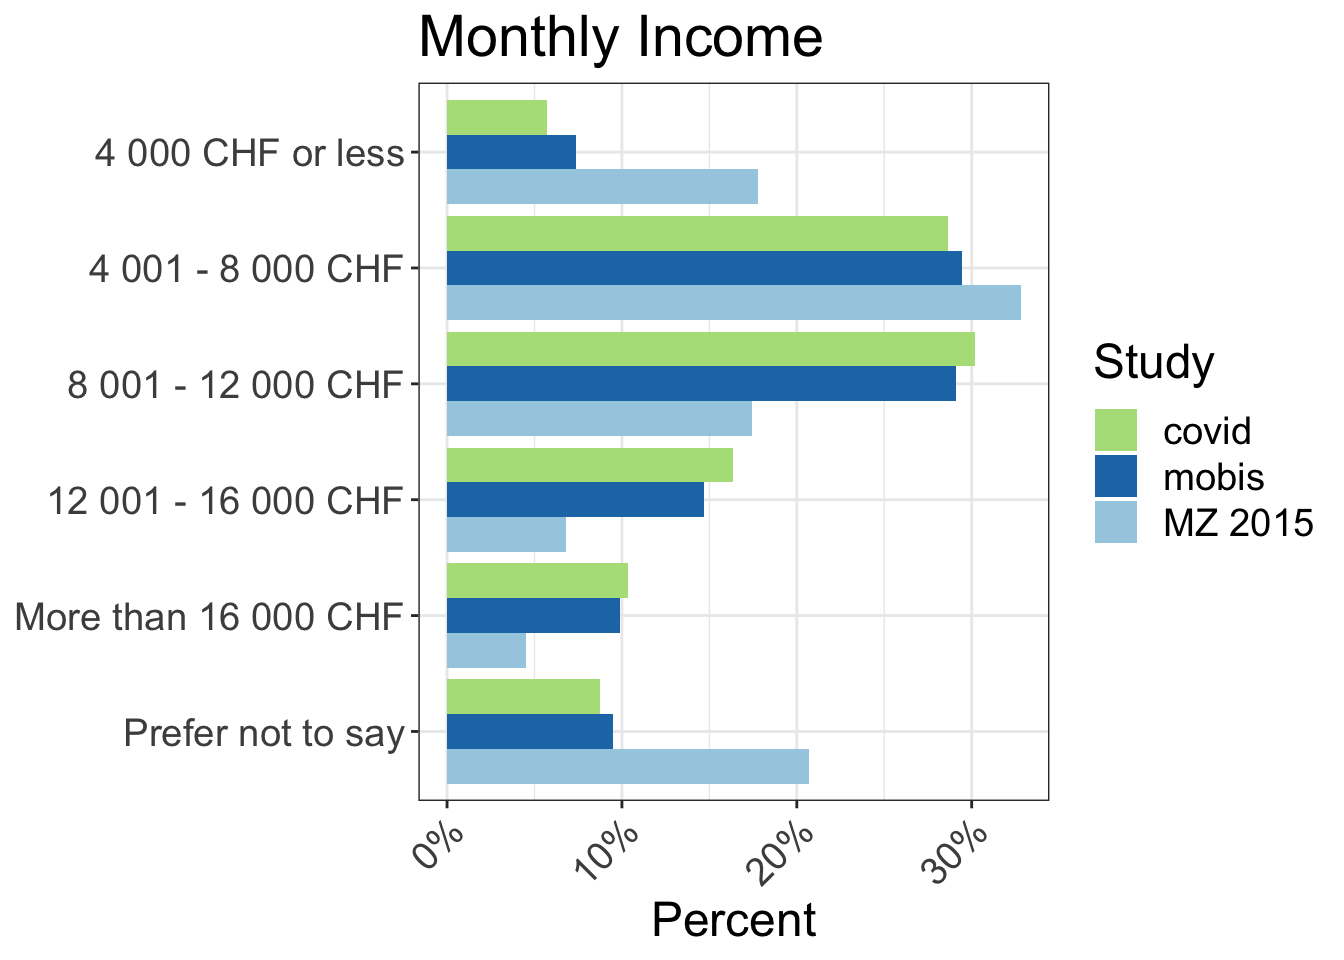
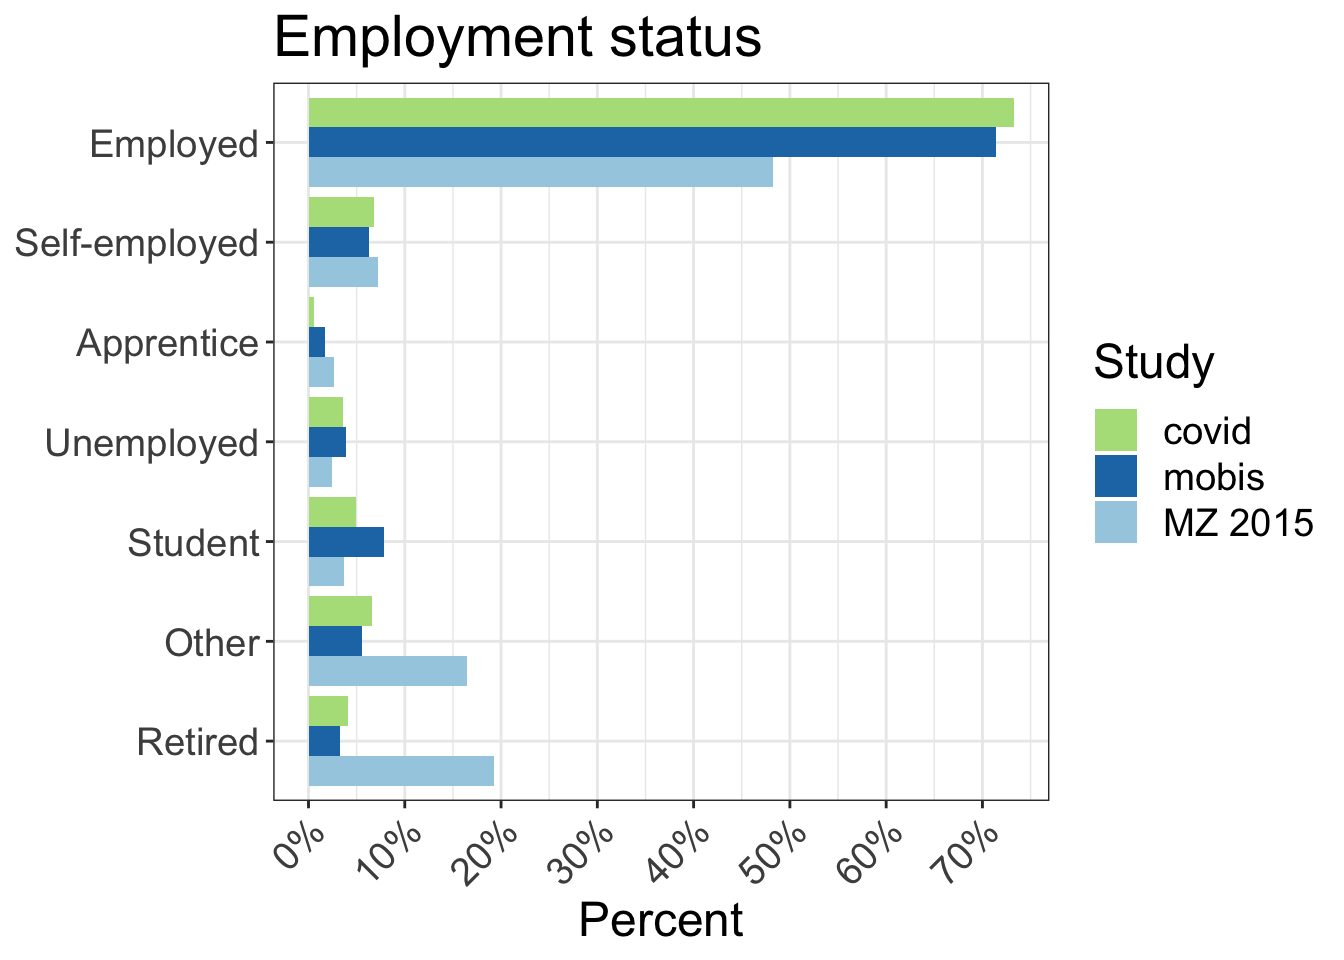
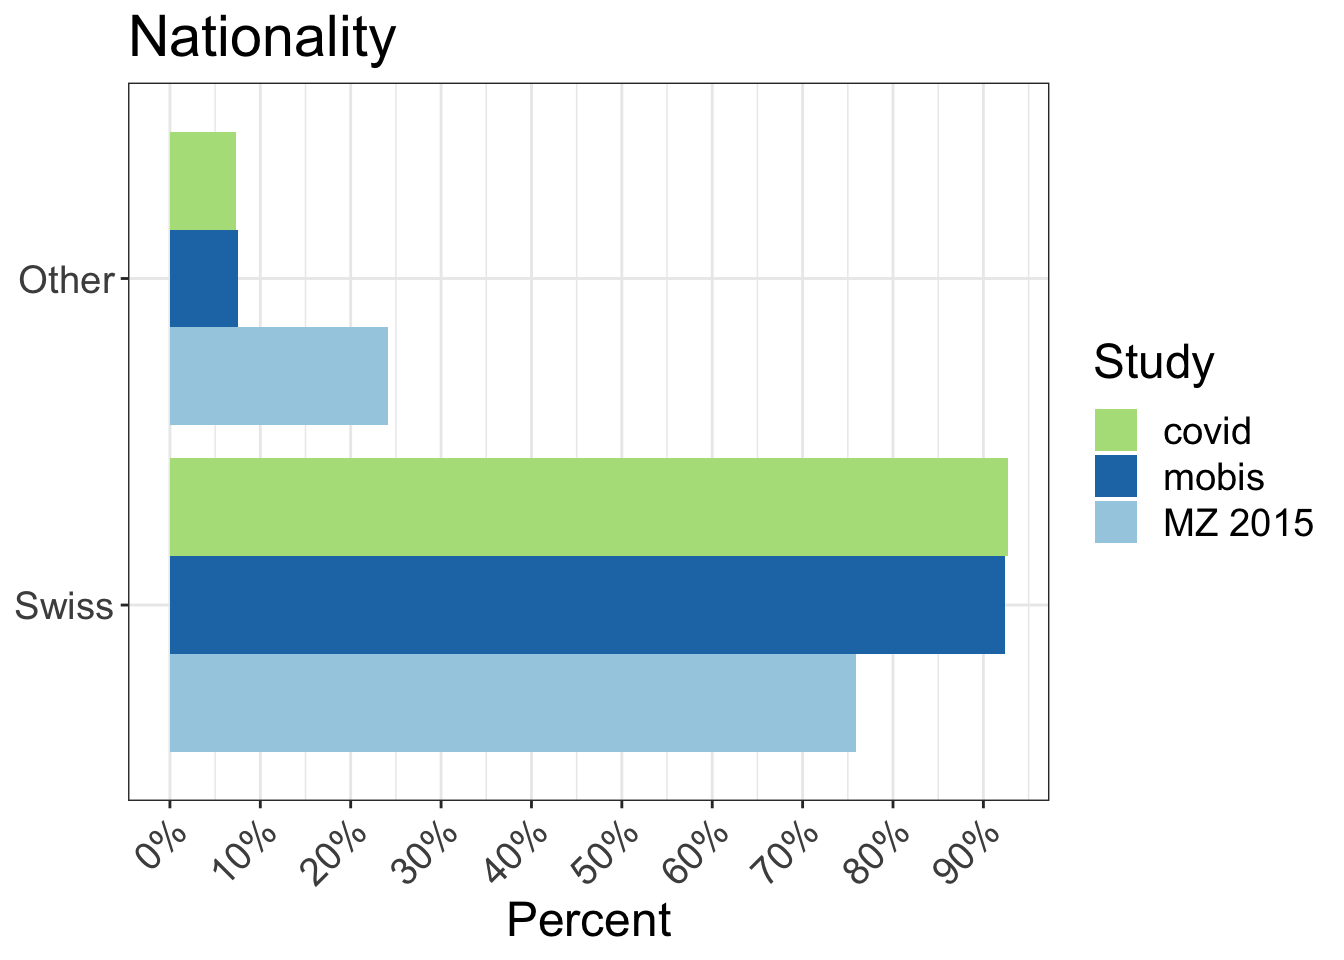
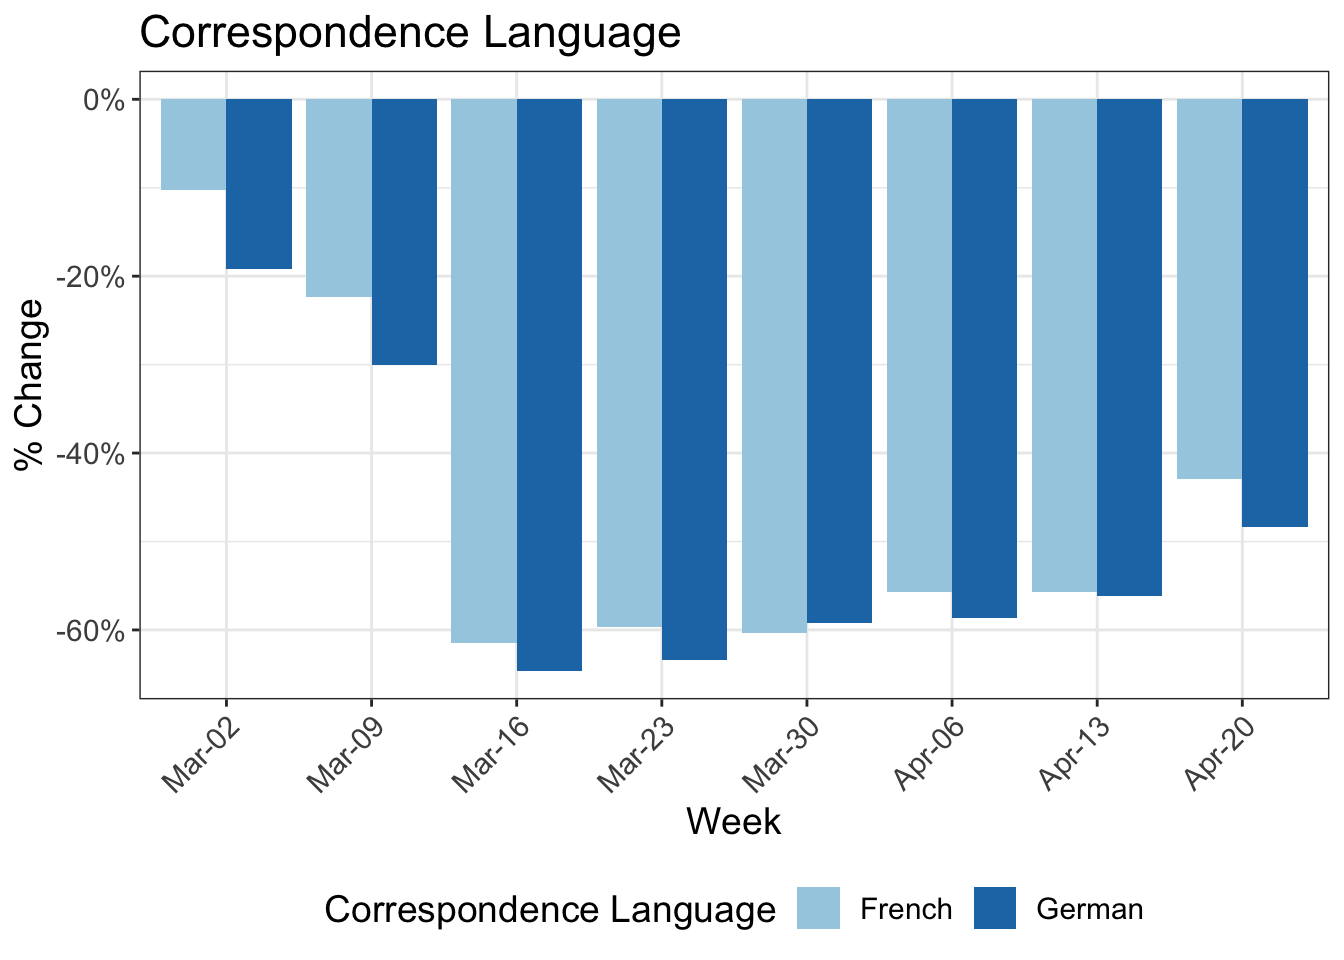
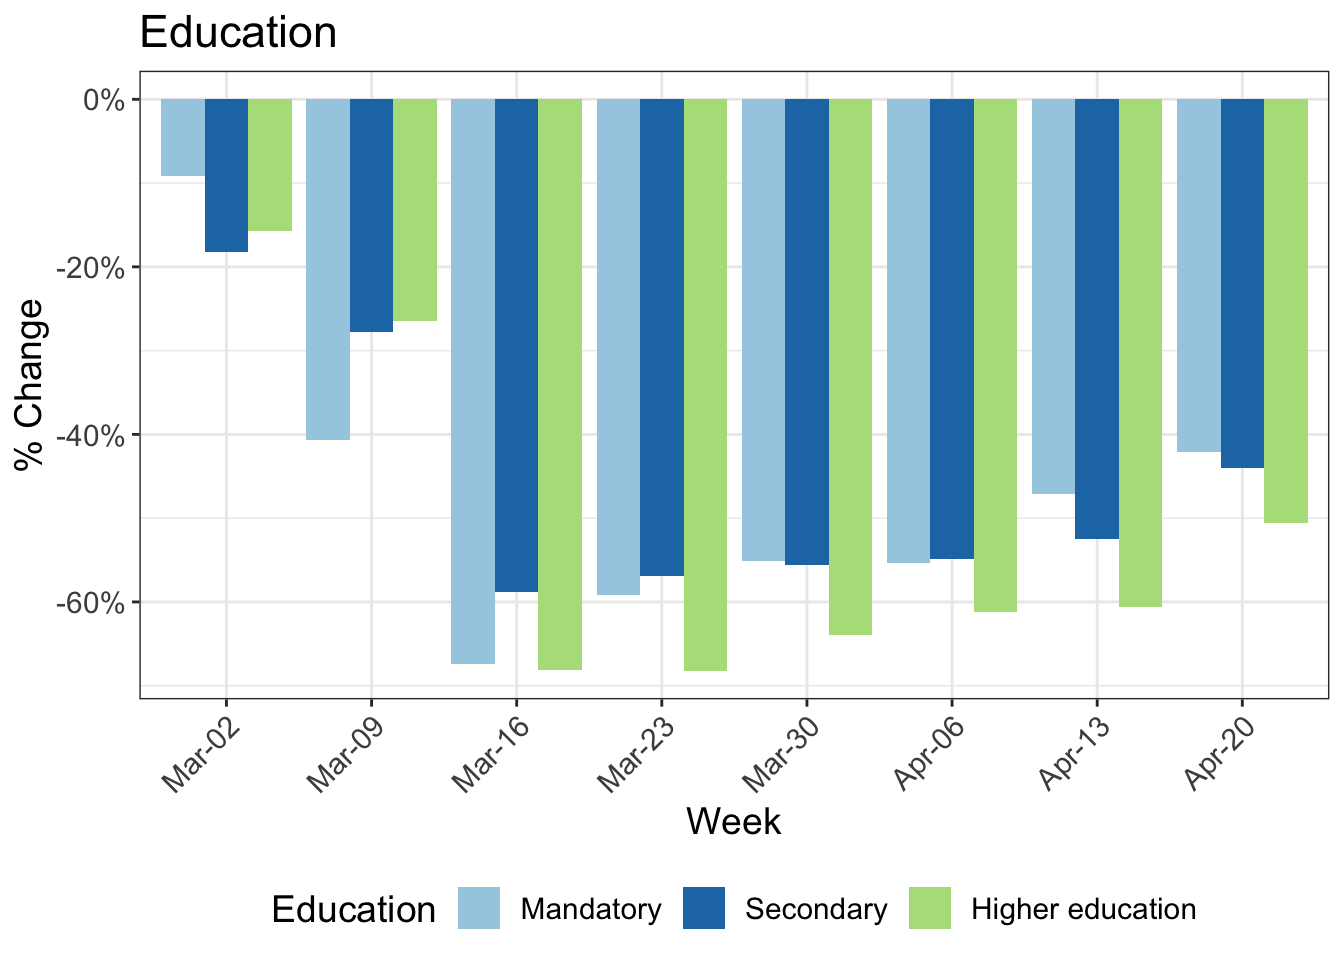
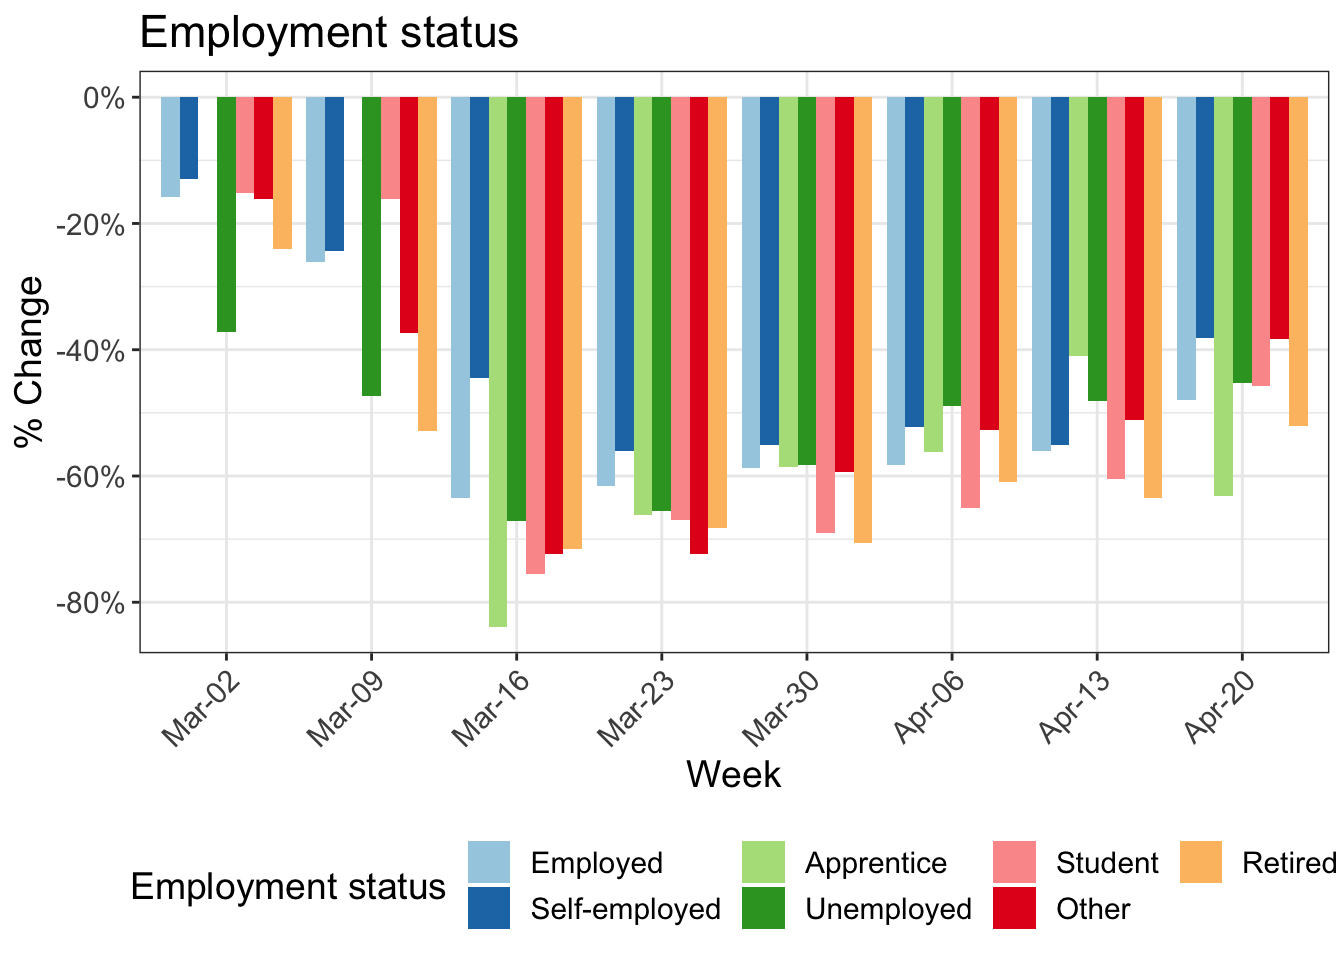
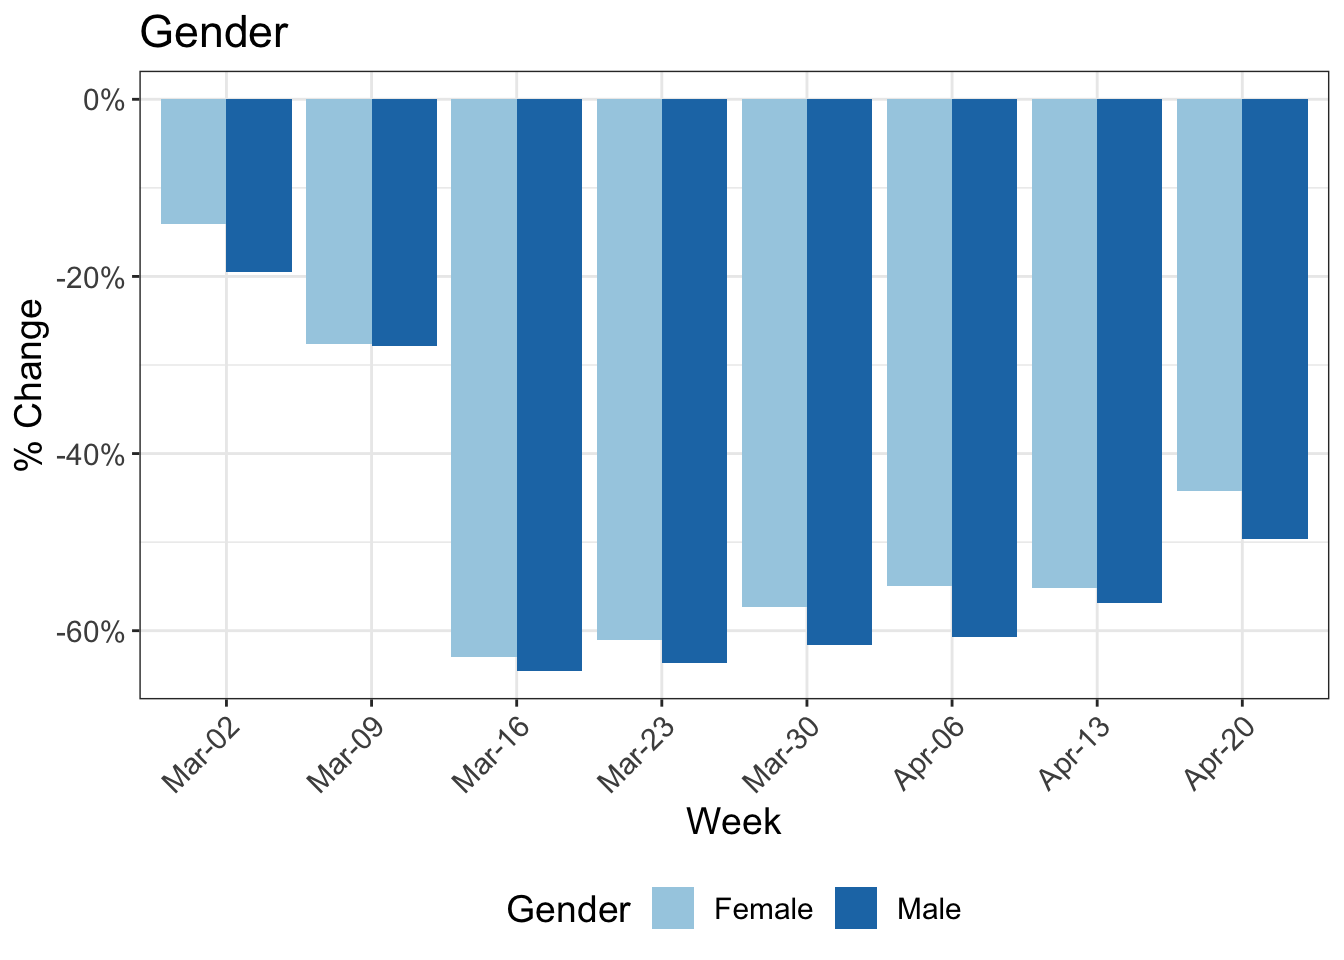
Differences in the distributions
The following charts show the characteristics of the MOBIS:COVID-19 sample compared to the original MOBIS Sample. There are some small differences, but generally the samples are consistent. This chart will be extended to compare to the relevant census data.
| Covid | MZ | Covid | MZ | |
|---|---|---|---|---|
| Aargau | 81 | 4,325 | 5.0 | 7.6 |
| Basel-Landschaft | 182 | 1,940 | 11.3 | 3.4 |
| Basel-Stadt | 39 | 1,555 | 2.4 | 2.7 |
| Bern | 188 | 7,244 | 11.7 | 12.7 |
| Fribourg | 8 | 1,942 | 0.5 | 3.4 |
| Geneva | 125 | 3,062 | 7.8 | 5.4 |
| Schwyz | 17 | 1,005 | 1.1 | 1.8 |
| Solothurn | 17 | 1,813 | 1.1 | 3.2 |
| Vaud | 290 | 5,303 | 18.0 | 9.3 |
| Zurich | 660 | 10,410 | 41.0 | 18.2 |
| Other | 3 | 18,491 | 0.2 | 32.4 |
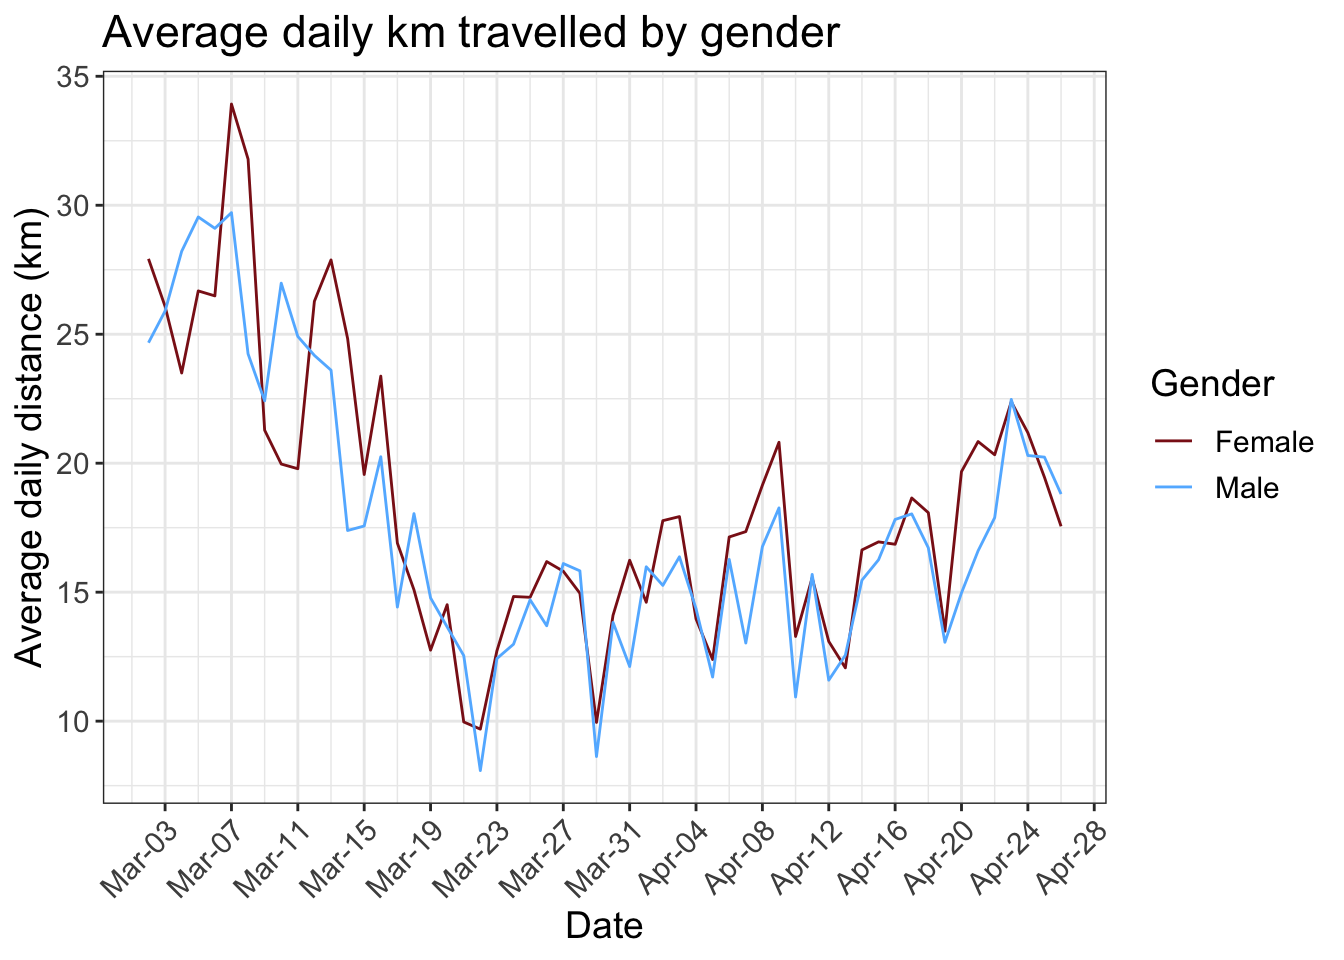
Average Daily Distance
Active Days
Change in kilometers travelled by transport mode
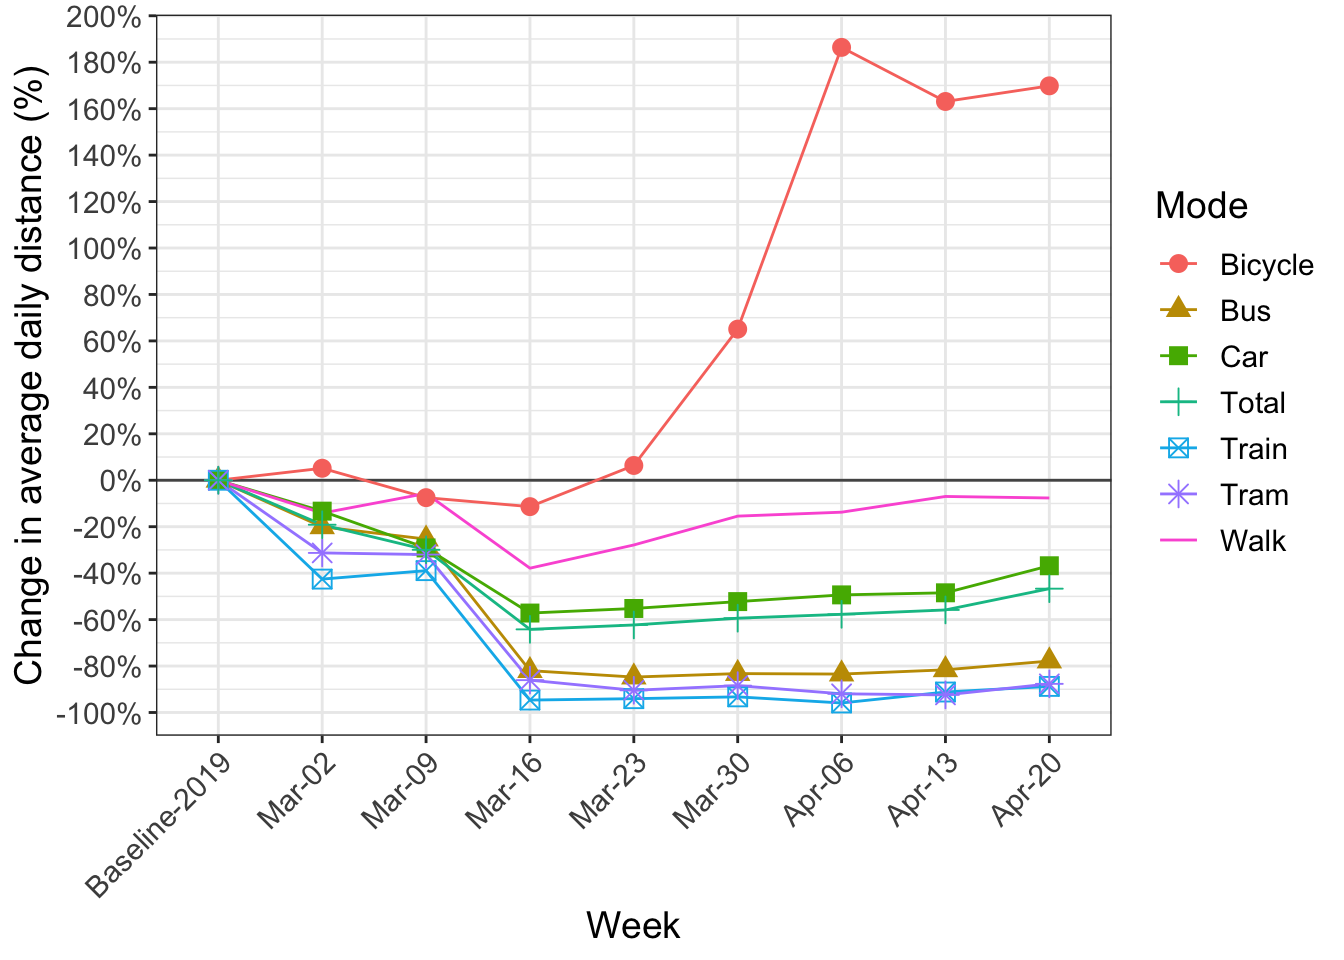
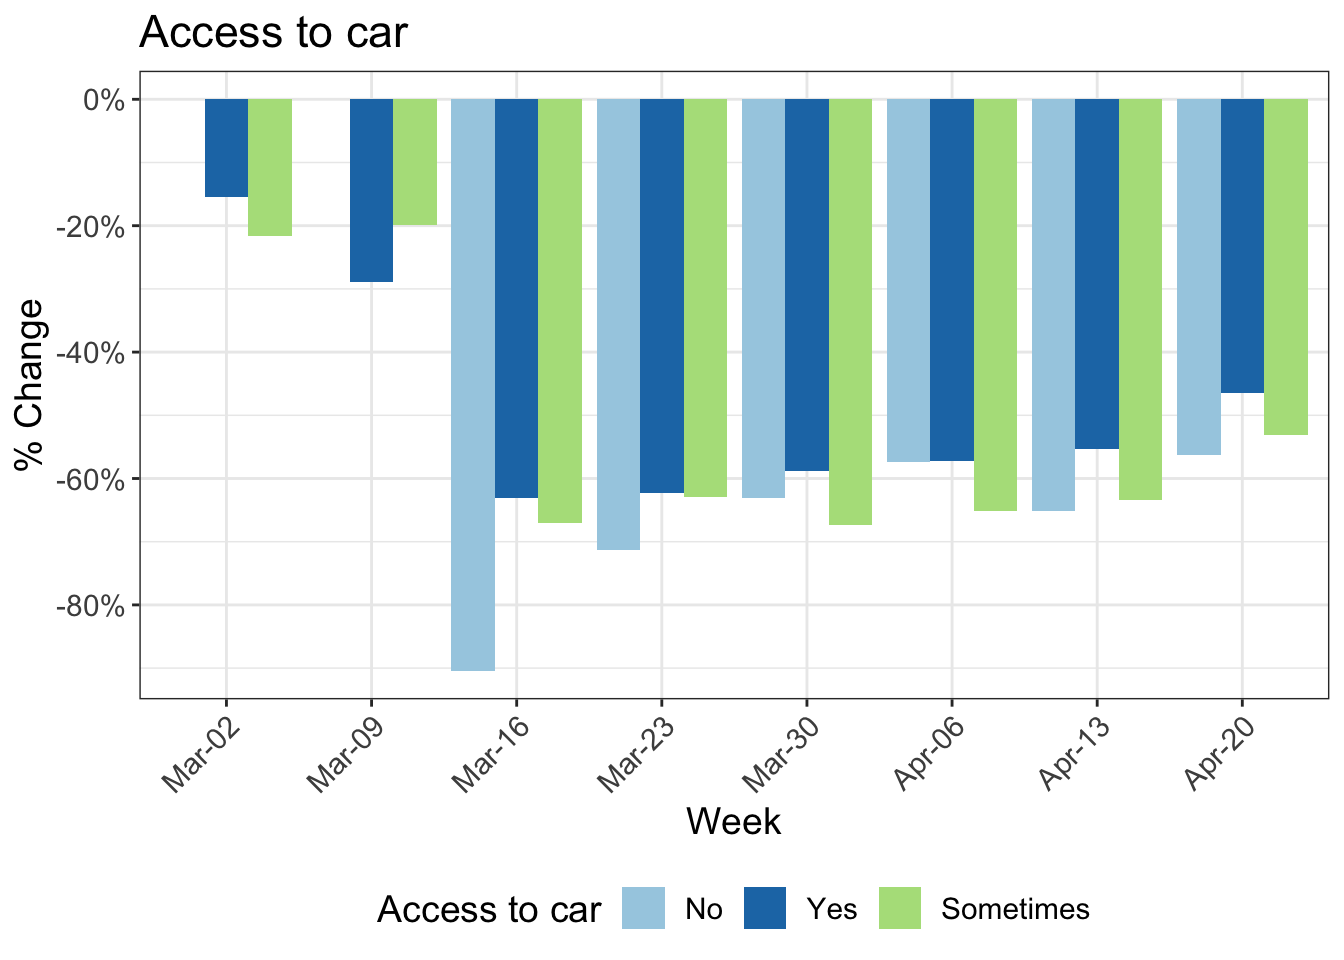
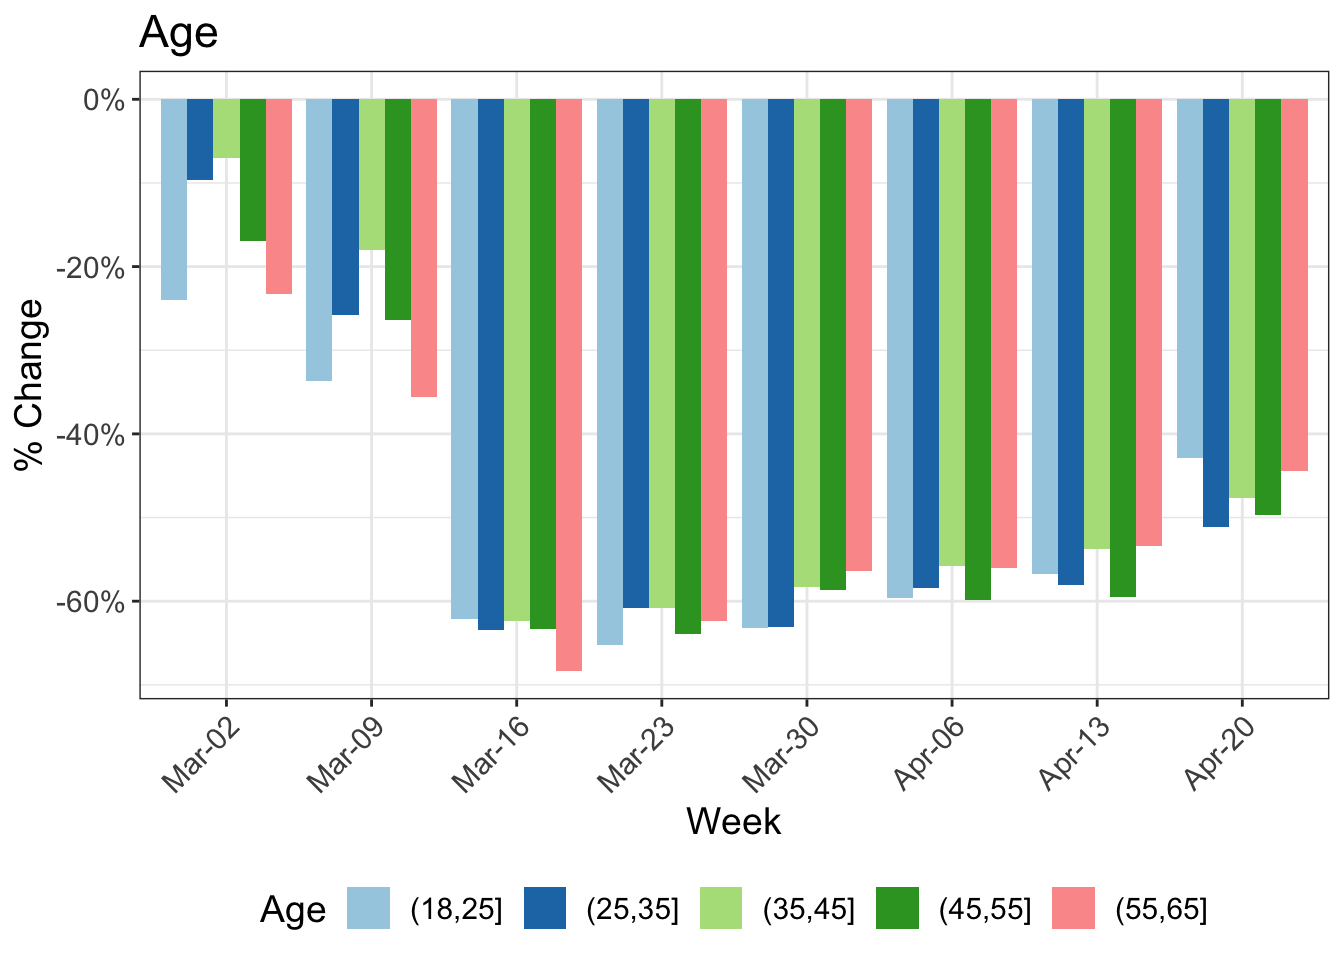
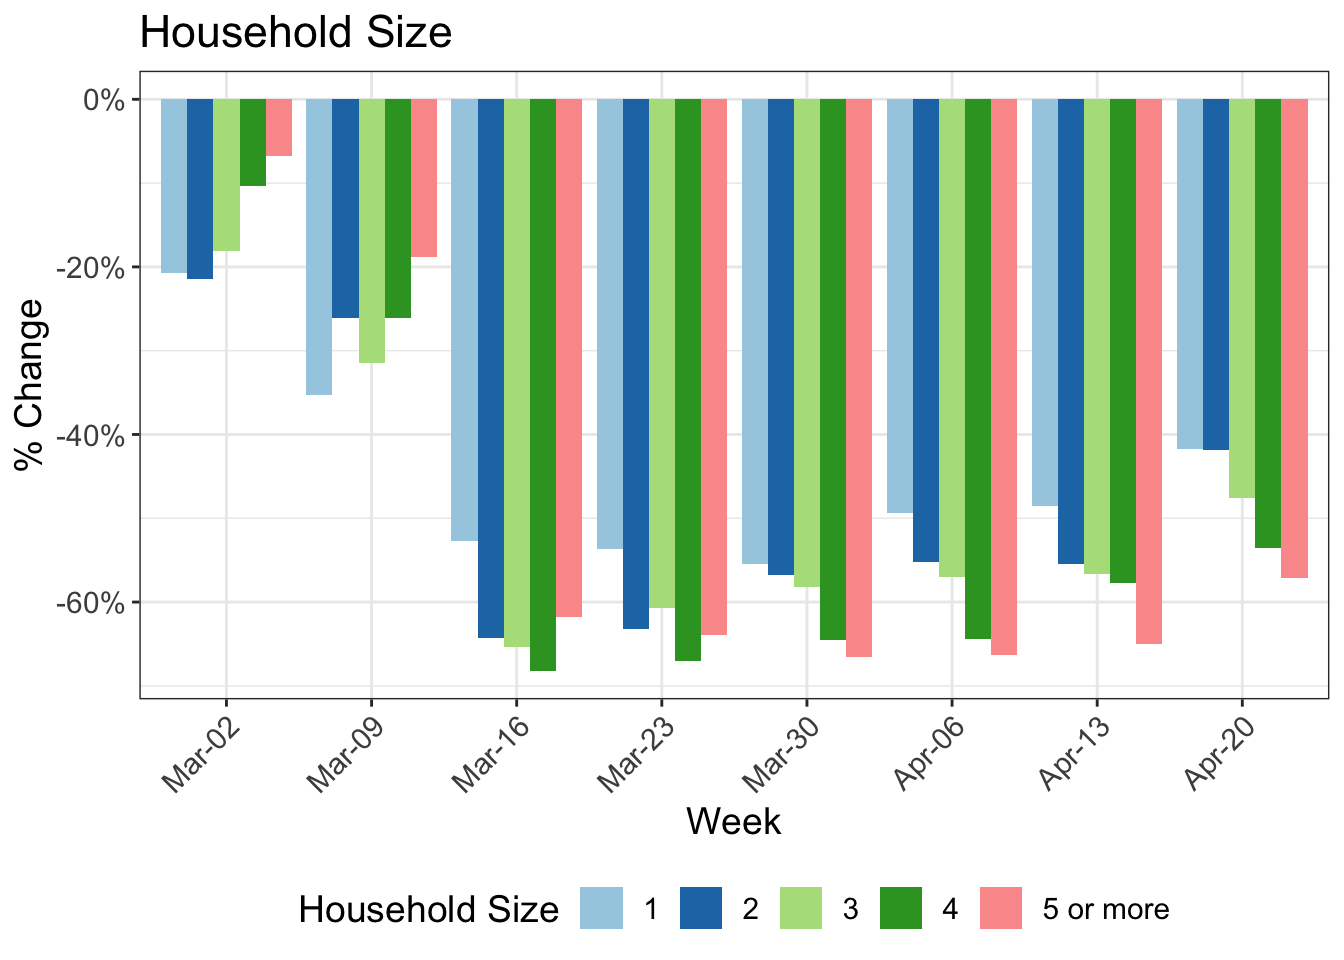
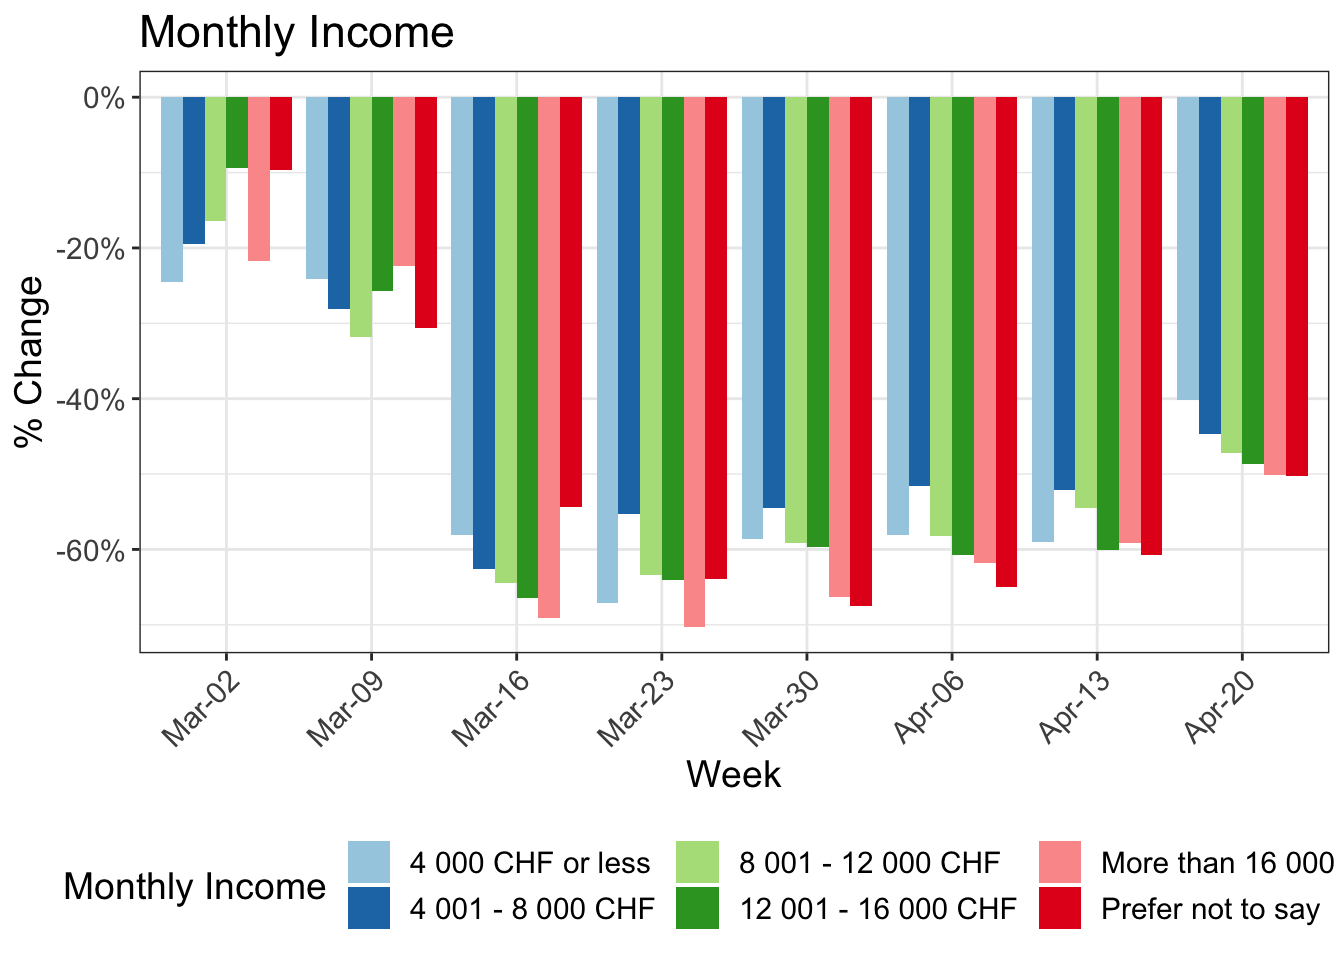
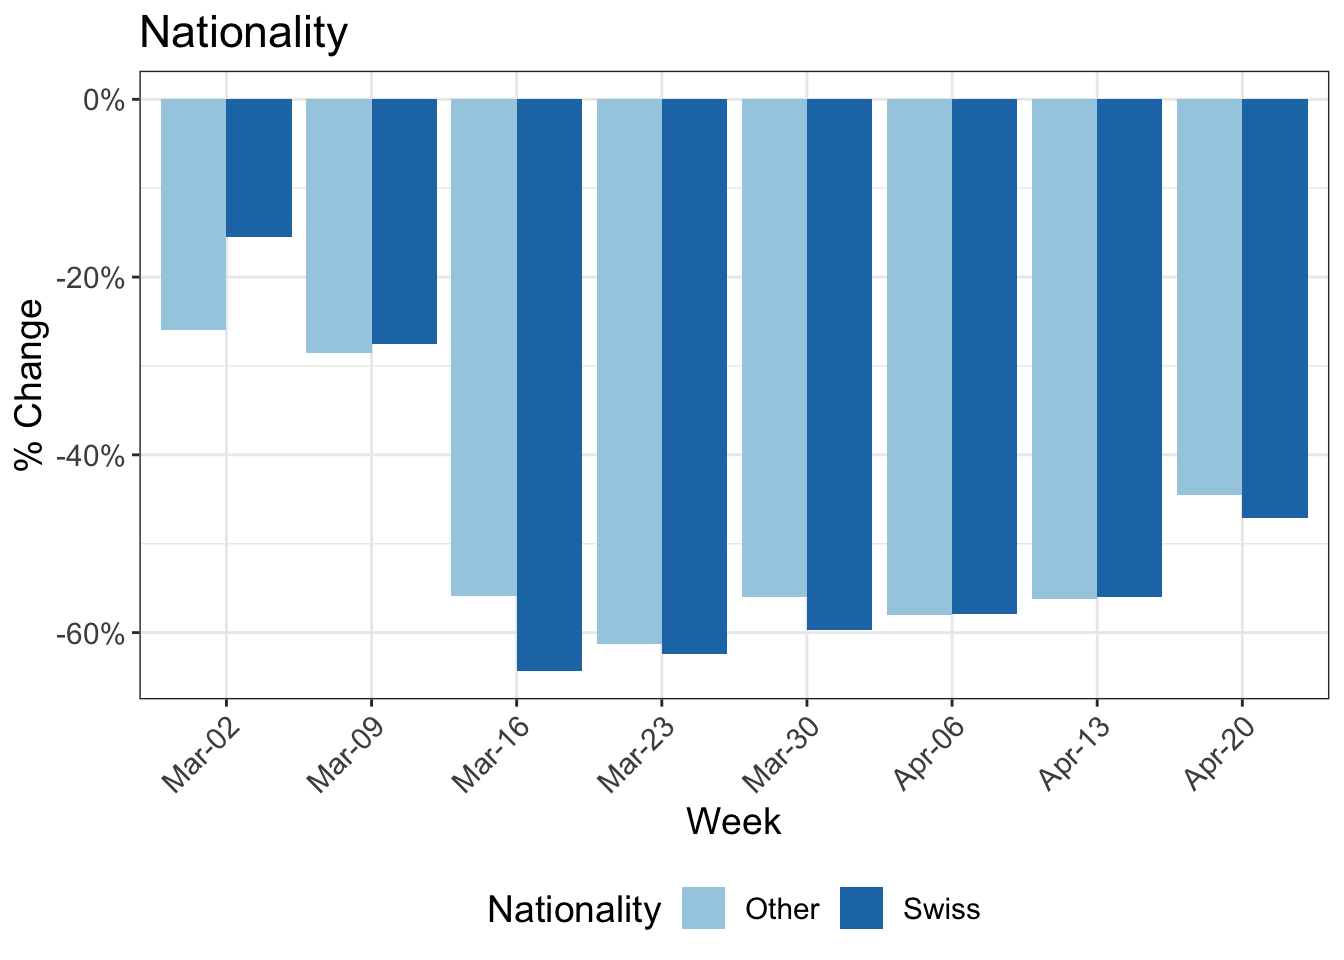
Change in kilometers travelled by:
Reduction in kilometers travelled by Canton
| Canton | N | Mar-02 | Mar-09 | Mar-16 | Mar-23 | Mar-30 | Apr-06 | Apr-13 | Apr-20 |
|---|---|---|---|---|---|---|---|---|---|
| Aargau | 60 | -25 | -41 | -71 | -58 | -50 | -57 | -55 | -41 |
| Basel-Landschaft | 150 | -14 | -9 | -60 | -61 | -59 | -60 | -55 | -52 |
| Basel-Stadt | 31 | -14 | -36 | -70 | -75 | -68 | -62 | -67 | -51 |
| Bern | 151 | -30 | -33 | -66 | -60 | -57 | -57 | -50 | -45 |
| Fribourg | 6 | -61 | -23 | -63 | -56 | -61 | -52 | -44 | -60 |
| Geneva | 103 | 9 | -44 | -68 | -61 | -58 | -65 | -56 | -43 |
| Schwyz | 10 | -24 | -13 | -55 | -70 | -50 | -49 | -42 | -29 |
| Solothurn | 16 | -13 | -41 | -62 | -65 | -53 | -49 | -50 | -27 |
| Vaud | 226 | -8 | -22 | -65 | -70 | -68 | -65 | -63 | -53 |
| Zurich | 545 | -17 | -25 | -60 | -59 | -57 | -53 | -54 | -43 |
Trip duration by transport mode and gender
| Mode | Gender | Baseline-2019 | Mar-02 | Mar-09 | Mar-16 | Mar-23 | Mar-30 | Apr-06 | Apr-13 | Apr-20 |
|---|---|---|---|---|---|---|---|---|---|---|
| Bicycle | Female | 15 | 15 | 16 | 14 | 19 | 27 | 31 | 39 | 27 |
| Male | 14 | 14 | 15 | 25 | 24 | 28 | 36 | 33 | 30 | |
| Bus | Female | 11 | 7 | 8 | 4 | 5 | 6 | 5 | 6 | 5 |
| Male | 11 | 8 | 9 | 7 | 7 | 6 | 7 | 7 | 6 | |
| Car | Female | 52 | 41 | 38 | 36 | 36 | 36 | 37 | 36 | 38 |
| Male | 51 | 47 | 42 | 34 | 34 | 35 | 35 | 35 | 35 | |
| Train | Female | 35 | 31 | 35 | 19 | 28 | 28 | 16 | 18 | 29 |
| Male | 35 | 25 | 33 | 12 | 26 | 23 | 19 | 25 | 23 | |
| Tram | Female | 15 | 13 | 16 | 8 | 14 | 14 | 9 | 7 | 12 |
| Male | 18 | 20 | 17 | 12 | 11 | 13 | 12 | 11 | 12 | |
| Walk | Female | 17 | 22 | 21 | 19 | 18 | 21 | 21 | 21 | 19 |
| Male | 17 | 20 | 20 | 16 | 18 | 20 | 21 | 21 | 19 |
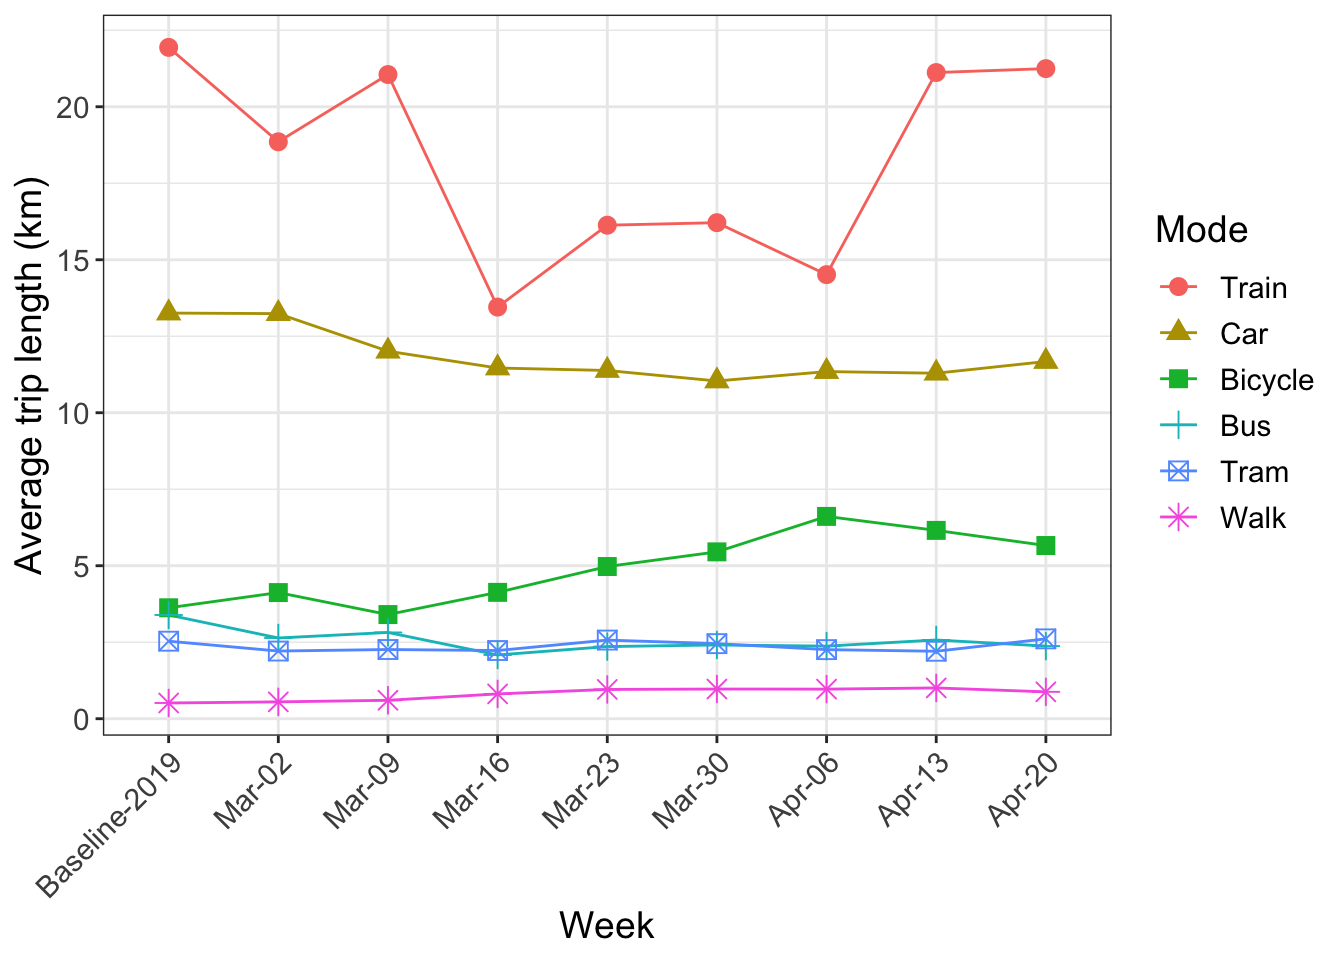
Average trip length by transport mode (km)
Activity space and daily travel radius
A commonly used definition of the activity space is the 95% confidence ellipse of the activity locations, in this case weighted by duration. In the following analysis, the activities at the home location are included, for those that had the app activated on that day. This is an important metric which gives an idea of the area in which travel is being performed. The daily travel radius is also presented.
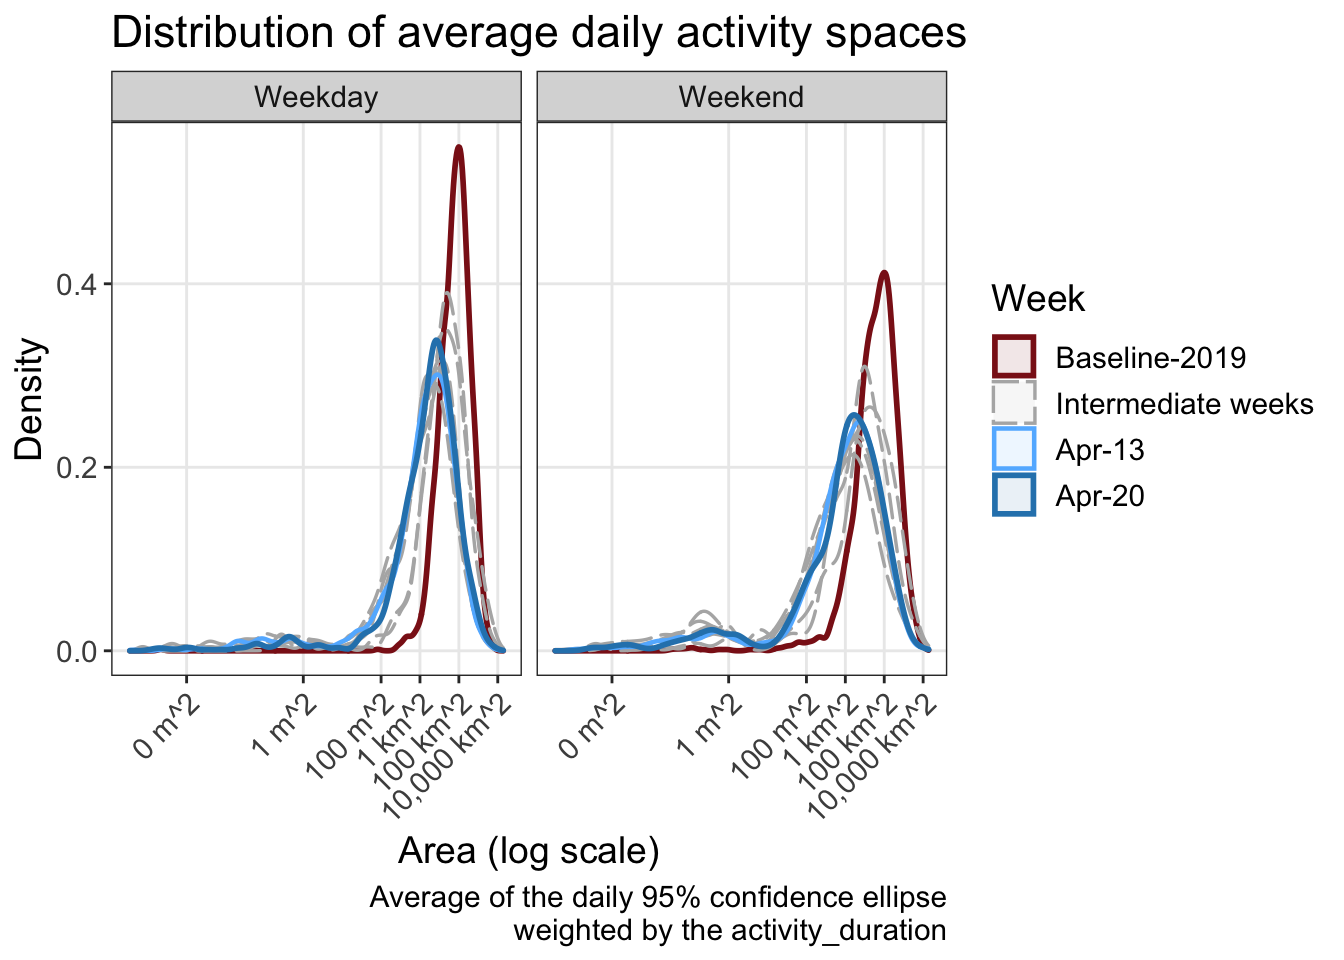
| Week | # Activities/day | Change | Area (km2) | Change | Daily Radius (km) | Change | |
|---|---|---|---|---|---|---|---|
| Baseline-2019 | Weekday | 4.75 | 199.68 | 10.08 | |||
| Weekend | 3.93 | 227.77 | 9.91 | ||||
| Mar-02 | Weekday | 3.98 | -16% | 188.70 | -5% | 8.70 | -14% |
| Weekend | 3.46 | -12% | 128.24 | -44% | 8.06 | -19% | |
| Mar-09 | Weekday | 3.97 | -16% | 119.97 | -40% | 7.39 | -27% |
| Weekend | 3.19 | -19% | 81.71 | -64% | 5.90 | -40% | |
| Mar-16 | Weekday | 2.87 | -40% | 31.27 | -84% | 3.96 | -61% |
| Weekend | 2.02 | -49% | 16.77 | -93% | 2.28 | -77% | |
| Mar-23 | Weekday | 2.67 | -44% | 34.51 | -83% | 3.60 | -64% |
| Weekend | 2.23 | -43% | 31.11 | -86% | 3.17 | -68% | |
| Mar-30 | Weekday | 2.87 | -39% | 41.02 | -79% | 3.82 | -62% |
| Weekend | 2.54 | -35% | 33.07 | -85% | 3.67 | -63% | |
| Apr-06 | Weekday | 2.94 | -38% | 37.09 | -81% | 4.08 | -60% |
| Weekend | 2.77 | -29% | 43.30 | -81% | 3.80 | -62% | |
| Apr-13 | Weekday | 2.97 | -37% | 40.90 | -80% | 4.33 | -57% |
| Weekend | 2.78 | -29% | 52.73 | -77% | 4.24 | -57% | |
| Apr-20 | Weekday | 3.28 | -31% | 57.93 | -71% | 4.96 | -51% |
| Weekend | 2.86 | -27% | 43.68 | -81% | 4.41 | -56% |
| Age | 2019 | Mar-02 | Mar-09 | Mar-16 | Mar-23 | Mar-30 | Apr-06 | Apr-13 | Apr-20 | |
|---|---|---|---|---|---|---|---|---|---|---|
| (18,25] | Weekday | 63.3 | 35.9 | 48.1 | 6.9 | 2.6 | 3.0 | 5.7 | 7.9 | 10.6 |
| Weekend | 35.6 | 5.8 | 9.8 | 0.6 | 0.9 | 0.8 | 1.2 | 1.3 | 2.4 | |
| (25,35] | Weekday | 70.9 | 85.2 | 42.6 | 2.3 | 4.9 | 4.6 | 7.4 | 6.1 | 10.5 |
| Weekend | 42.6 | 14.5 | 3.3 | 0.4 | 0.6 | 1.3 | 2.3 | 1.8 | 2.6 | |
| (35,45] | Weekday | 76.3 | 36.4 | 75.0 | 6.8 | 3.3 | 7.6 | 8.2 | 10.8 | 11.3 |
| Weekend | 24.3 | 29.9 | 20.5 | 0.4 | 1.6 | 0.8 | 1.4 | 1.5 | 4.2 | |
| (45,55] | Weekday | 74.1 | 40.5 | 53.8 | 4.0 | 3.1 | 4.4 | 7.0 | 5.2 | 10.0 |
| Weekend | 28.1 | 13.3 | 7.0 | 0.7 | 1.2 | 1.6 | 1.6 | 2.3 | 4.0 | |
| (55,65] | Weekday | 67.0 | 64.0 | 46.4 | 7.3 | 2.8 | 5.8 | 5.1 | 7.1 | 8.6 |
| Weekend | 21.3 | 9.1 | 8.7 | 0.1 | 1.2 | 1.1 | 1.2 | 3.8 | 3.1 |
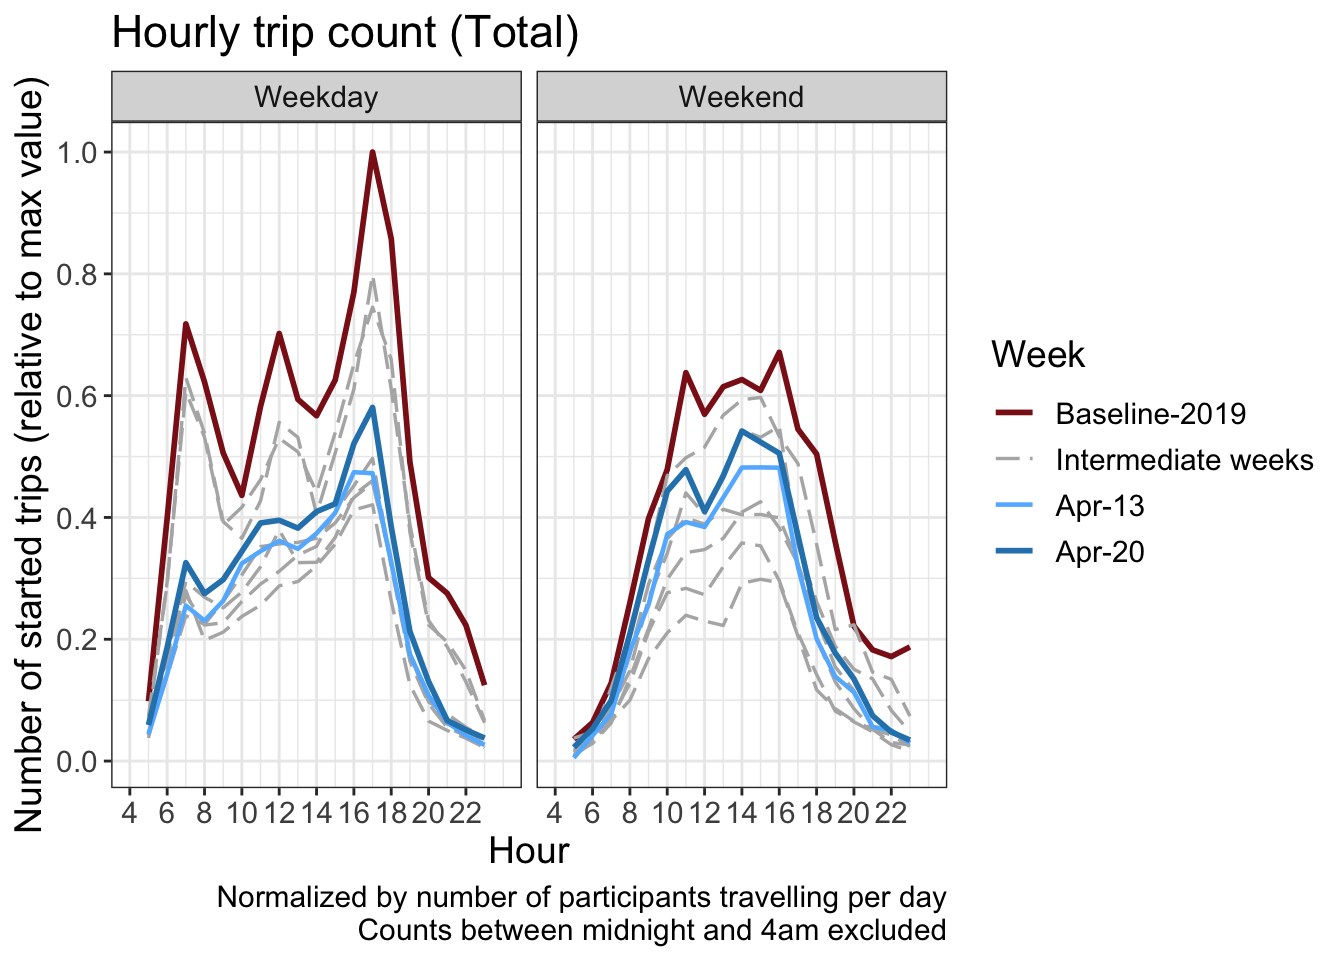
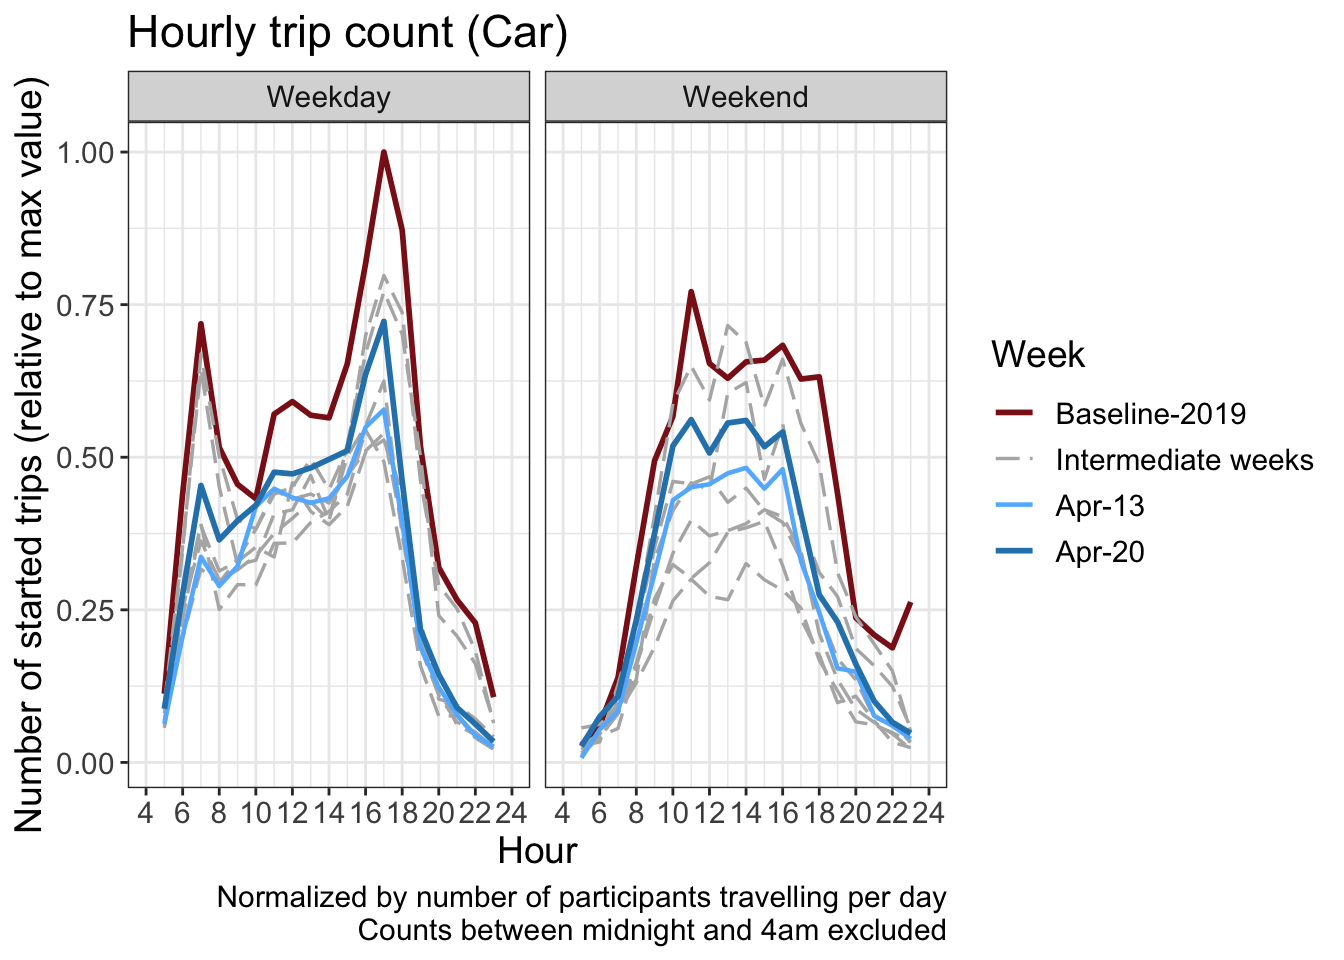
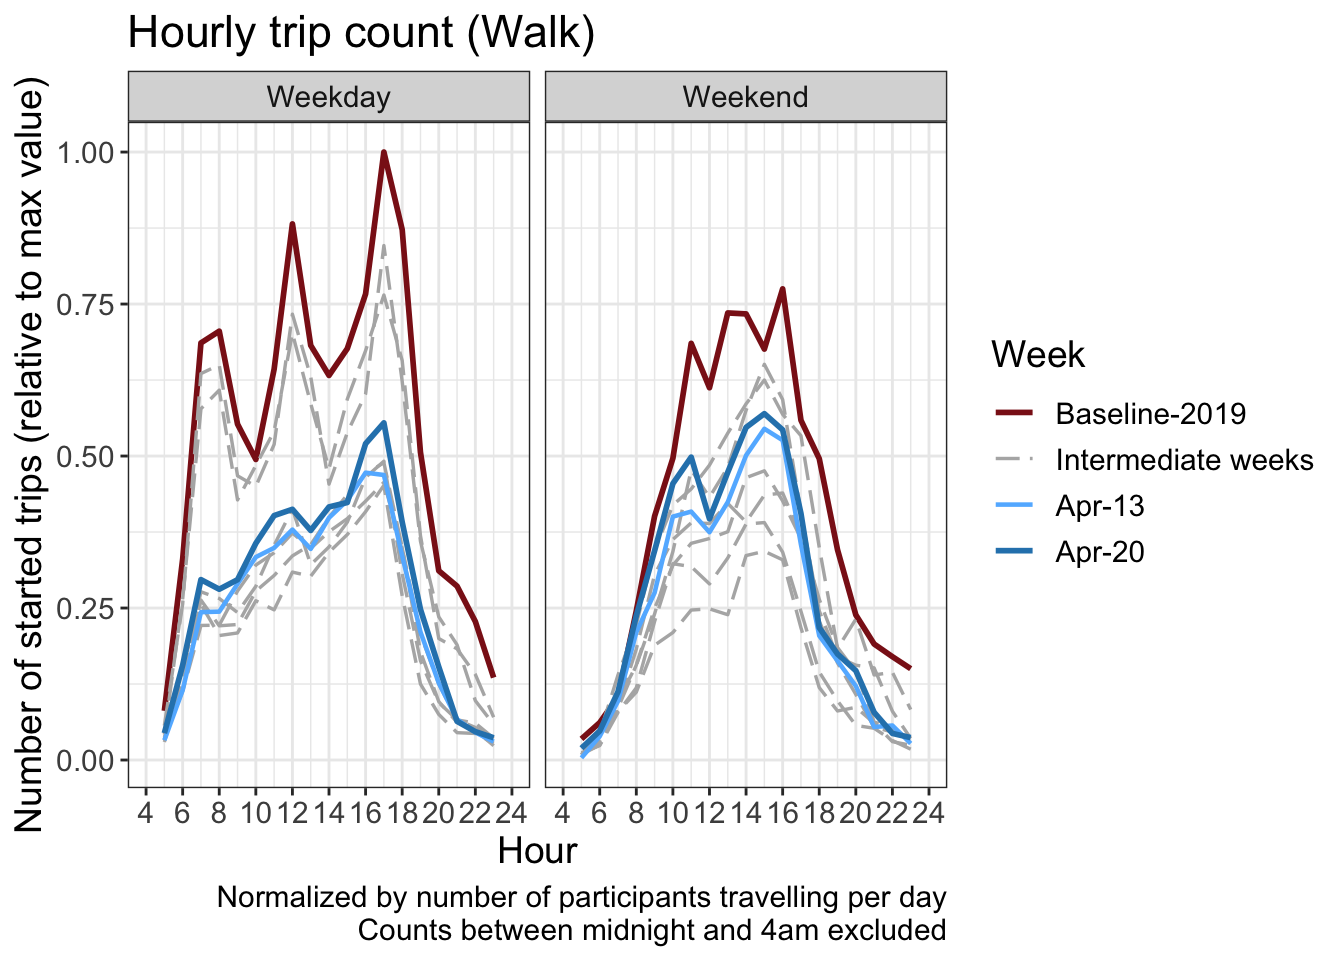
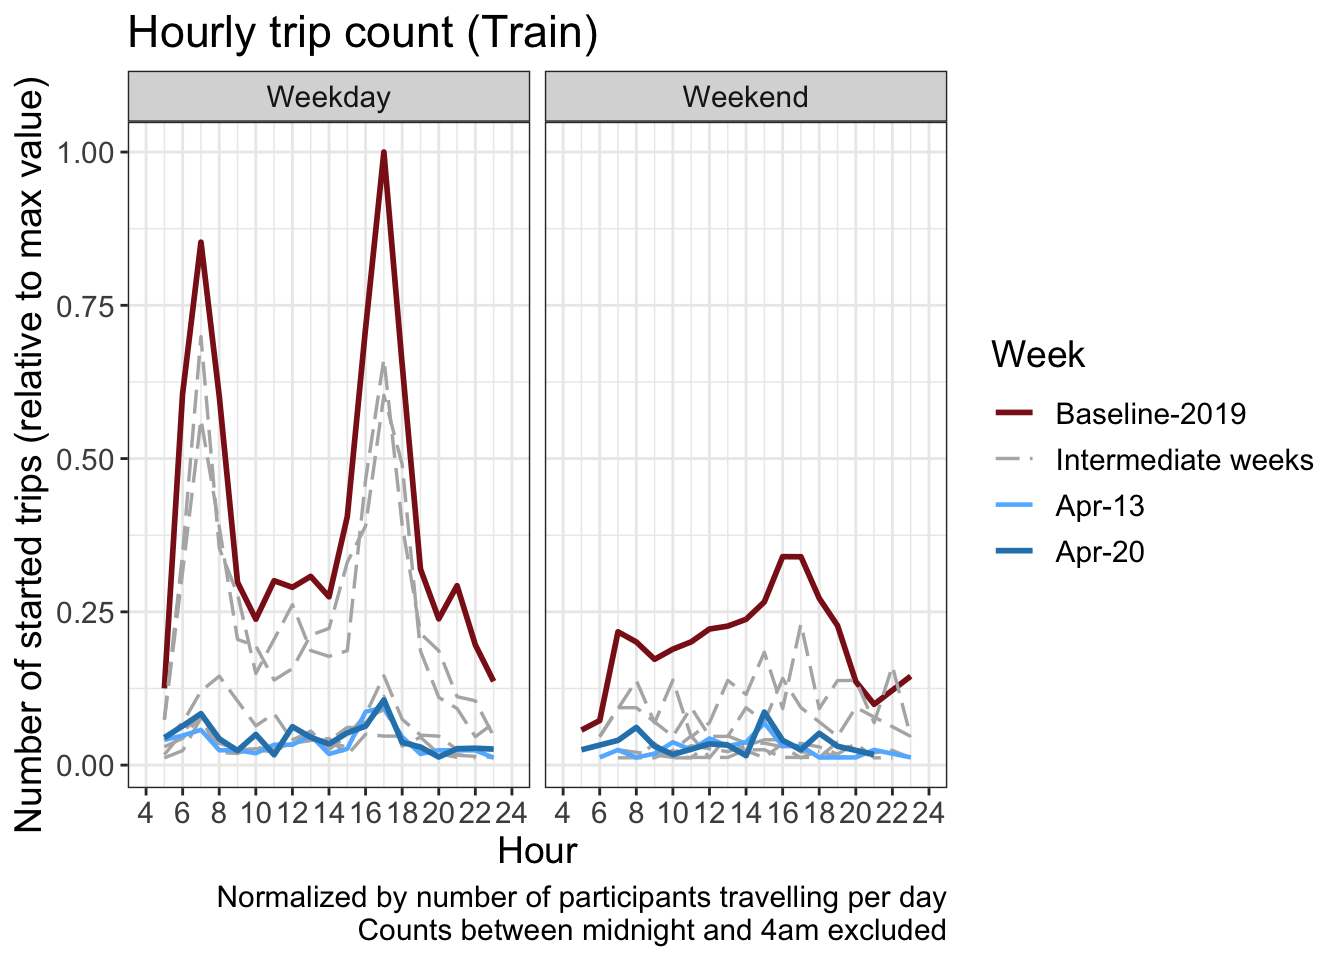
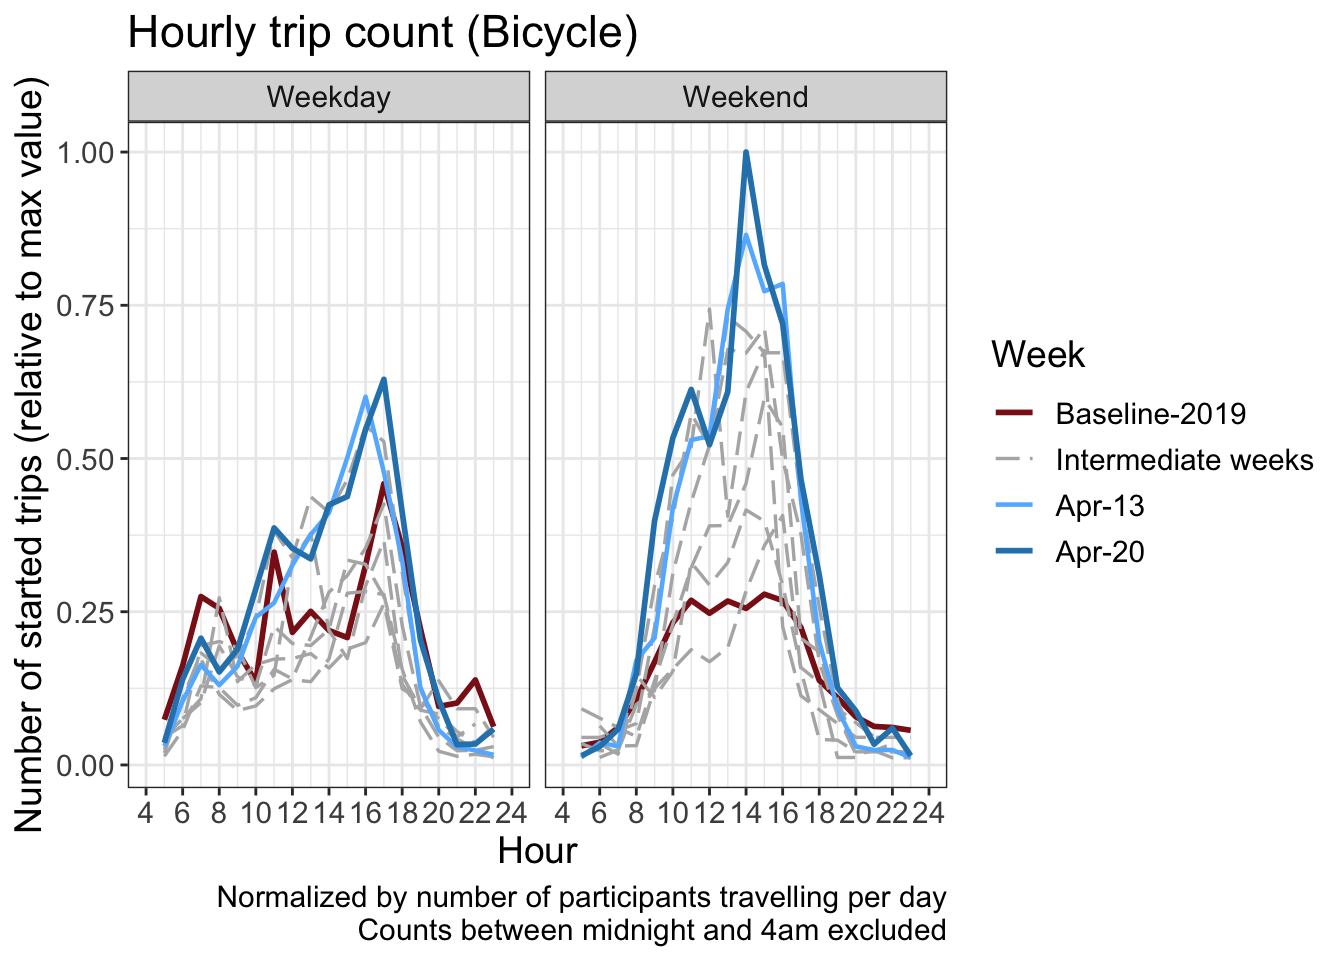
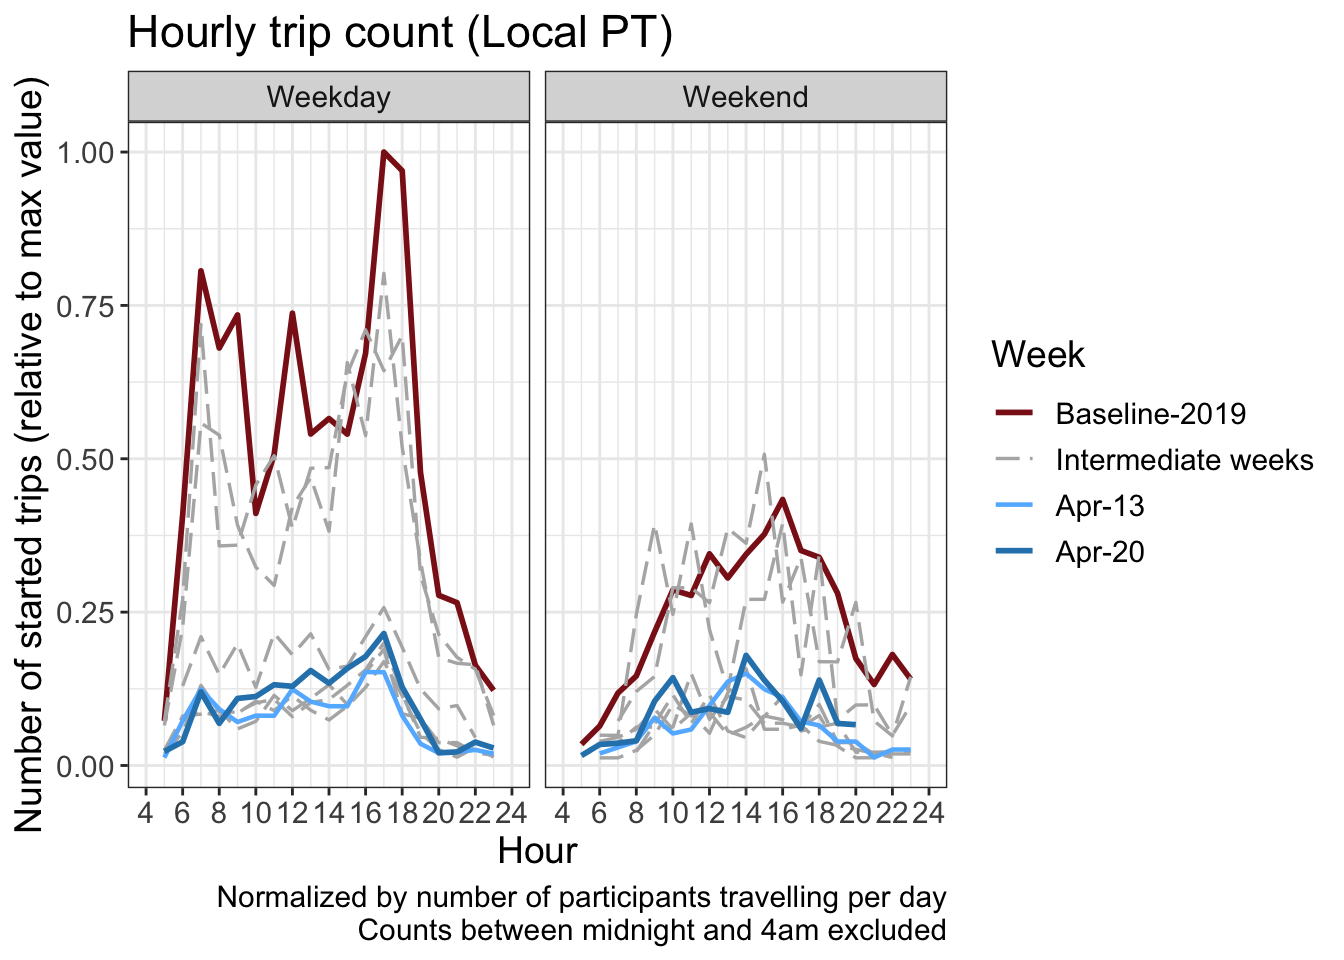
Hourly Counts
The number of trips started per hour. The y axis is normalized by the maximum hourly value in the graph.
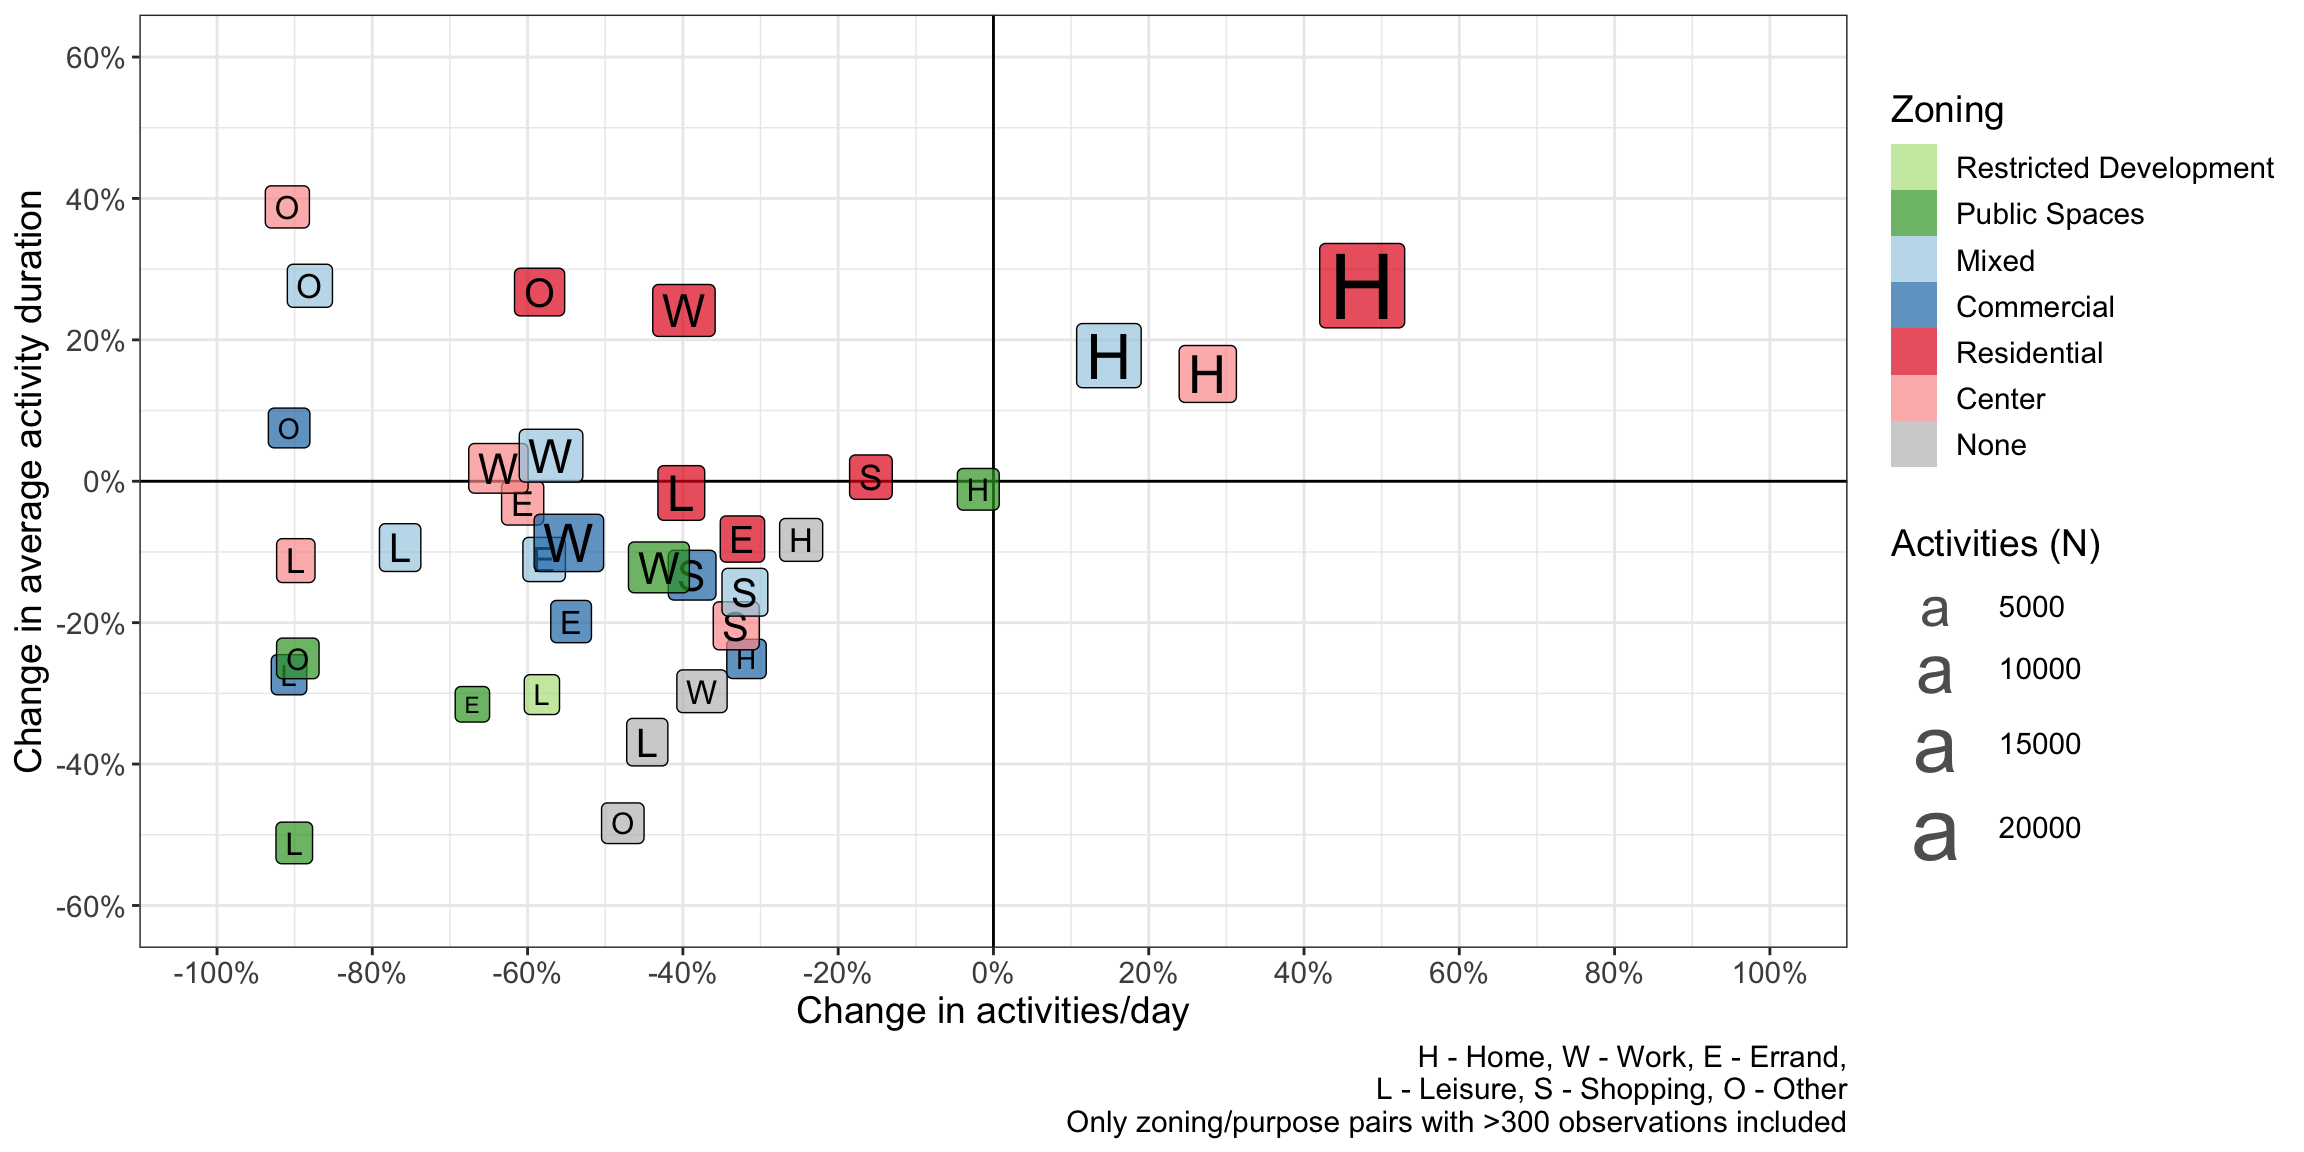
Activity types and zoning
Around 30% of activities were voluntarily labelled with their purpose by participants using the app. Work is ongoing to impute the purposes for the rest of the activities. Using simplification of the ARE development zoning classification, the activities are assigned with the closest zone classification within a 100m radius. The following graph shows how both the activity duration and the number of activites has changed from the baseline period in 2019 to the COVID-19 period.
Please note that only stationary leisure activites are included, not walking/cycling/hiking/etc